


The rapid deceleration in the economy is catching many by surprise as each new economic release continues to build support for a coming recession and subsequent policy response. President Obama is slated to release a new program to increase employment by more deficit spending in the near term supported by longer term deficit reduction plans. Fed Chairman Ben Bernanke is likely to hint at future monetary stimulus next week like he did at last year’s Jackson Hole symposium. While fiscal and monetary policy response is sure to come and will likely lift the stock market momentarily, we may be reaching a point where monetary policy is pushing on a string and may be ineffective in turning the economy around. Additionally, given the push back from the Tea party to expanding deficits and growing anger against money printing by the Fed (see Perry: Bernanke Almost ‘Treasonous’ for Printing Money), we may need to see ever further deterioration in the economy/markets before Fed and fiscal hawks voices fall by the way side.
Profit Margin Squeeze Coming
Exactly three years ago the market was recovering in August 2008 after the S&P 500 experienced a bear market by falling more than 20% from its October 2007 top to its July 2008 bottom. Some at the time were touting the deep value in the markets and that it was a great time to buy. However, there was a great risk still ahead that prevented me from turning bullish which I wrote about in “The Worst Is Yet to Come” (08/27/08), which is the likely mean reversion to take place in corporate profits. It appears, like another case of Déjà vu, the S&P 500 just fell short of reaching bear market status by falling 19.6% from its May high to its low last week at 1101.54 and the value calls by market pundits are ringing loud once again. However, the same issue of corporate profit margins that concerned me three years ago is back, and this time at even higher elevated levels. Looking at actual corporate profits relative to normalized levels (= GDP x 8.5%, average pre-tax margins since 1980) shows we are even above the multi-decade record seen in 2008 with corporate profit margins at high risk of returning to normal levels. Falling profit margins means falling earnings which translates to lower S&P 500 earnings expectations and thus lower price targets as reality disappoints consensus optimism.

Source: BEA
One gauge of corporate profit margins is the interplay between the prices of crude materials (corporate inputs) to finished goods (corporate outputs) which is seen in the Producer Price Index (PPI) report. The always insightful Doug Short points out that, while not at the extreme seen in the summer of 2008, the PPI crude goods to finished goods ratio is quite elevated and matching the high seen in August 1973.
Profit Margin Squeeze Continues to Challenge the Economy
By Doug Short
August 18, 2011
Source: Doug Short
Click here to enlarge
And how did the markets respond to the profit margin squeeze seen in 1973 you may ask? The image below tells the unpleasant story in which the S&P 500 initially declined by over 15% before staging an oversold rally and then finally plunging nearly 50%. The likely decline in profit margins to come will catch analysts off guard as they typically miss economic and financial turning points.

Source: Bloomberg
Click here to enlarge
Economists/Analysts ALWAYS Get it Wrong at Economic Turning Points
Perhaps one of the easiest ways to determine economic turning points is by how far off the mark economists and analysts are from their projections and in what direction. The reason for this is that future expectations are often determined to a great extent by projecting forward past results. Thus, they overshoot when the economy and markets are peaking and they undershoot just as the economy and markets are putting in a bottom. This was one of the points I made in my August 2008 article in which I used the following Bloomberg piece to highlight the point, “Analysts' Accuracy on U.S. Profits Worst in 16 Years.”
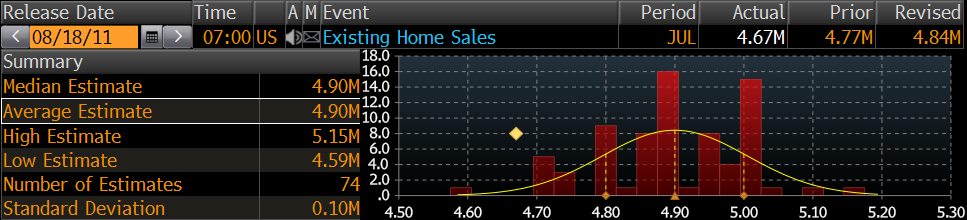
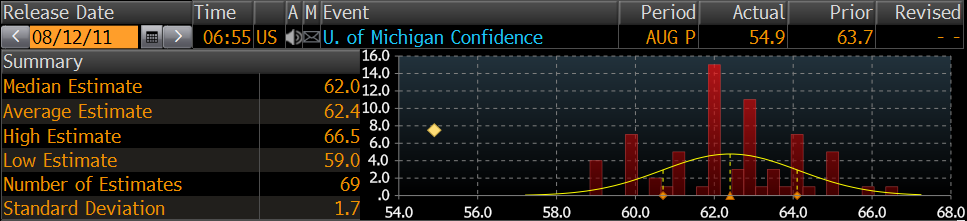
Thus, the MAJOR miss by economists over the last month should raise some eyebrows that perhaps we are yet again at a significant economic turning point. Just look at how far off the mark economists have been on reports ranging from housing, consumption, sentiment, manufacturing, and the overall economy (GDP) in the images below which shows the range of estimates on the x-axis (bottom pane) and the actual result (diamond).
Existing Home Sales (July)
Source: Bloomberg
Click here to enlarge
Personal Consumption (Q2 2011)

Source: Bloomberg
Click here to enlarge
University of Michigan Consumer Confidence (August)
Source: Bloomberg
Click here to enlarge
Philadelphia Fed Manufacturing Survey (August)

Source: Bloomberg
Click here to enlarge
Gross Domestic Product (GDP, Q2 2011)

Source: Bloomberg
Click here to enlarge
Take special note of the discrepancies for the Michigan Consumer Confidence and Philly Fed Survey as those were the largest misses by far and also happen to be August reports. Looking at July’s actual versus predicted results were off the mark but not as far off as August has been. This suggests that economic activity may have peaked in June/July and is now rolling over materially faster than economists can downgrade their estimates. Given the deterioration that is occurring, Fed Chairman Ben Bernanke is not likely to remain idle.
Bernanke’s Worst Nightmare: Pushing on a String
I am a big believer in using leading economic indicators for monitoring the business cycle which directly affects asset allocation and overall financial market returns; therefore I track the most widely known leading economic indicators (LEIs) from the Conference Board and the Economic Cycle Research Institute (ECRI). Back in 2009 when the Conference Board’s LEI was sharply rising I was curious to understand how the Conference Board calculated their LEI and what weightings were placed on economic versus monetary indicators that Fed Chairman Ben Bernanke directly affected.
Given the lack of response in consumer sentiment and the slow turn in the economy well after the Conference Board’s LEI bottomed I wanted to test my hunch of a minimal passthrough of improvement in the monetary components into the economic components, and thus why consumers remained depressed. When looking at the breakdown in the Conference Board’s LEI I was surprised to find that it had ten components and of those ten only three were financially-related and yet they composed nearly half the overall weight, with the greatest single influence coming from the M2 money supply (32% weight).
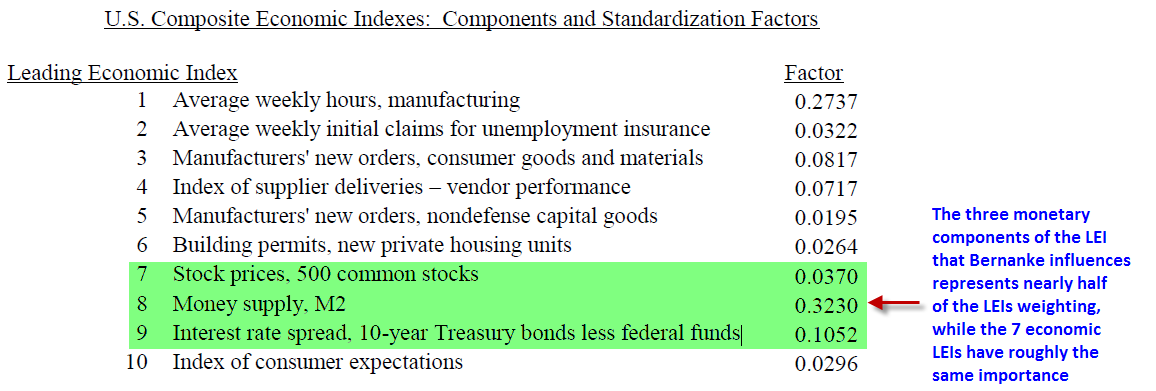
Source: The Conference Board
Click here to enlarge
To figure out what the economic components of the LEI were doing relative to the monetary components I broke out the two segments and reconstructed the data. What I found was that there was a close fit between the monetary and economic components with the overall headline LEI in the 1960s-1980s but the monetary and economic LEI components diverged materially over the last decade as less and less monetary stimulus found its way into the economy. We have finally approached what Barry Bannister coined the “Zero Hour” where a dollar of new debt produces zero dollars of GDP growth.

Source: Conference Board
Click here to enlarge

Click here to enlarge
Source: Marc Faber, Gloom Doom and Boom Report
What Bernanke has been fighting is the deflationary forces resulting from consumers being forced to deleverage. The Great Recession began with a vicious cycle of consumers pulling back, banks not able to lend, and corporations holding cash due to weak consumer demand. In order to fight this deleveraging trend Fed Chairman Bernanke continues to throw money at the system hoping the mud will stick. The problem is more and more of his money printing is slipping to the floor rather than fortifying the walls. While many cheered this week’s release of the July reading for the Conference Board’s LEI, what no one realized or commented on was that the spread between the monetary components and the economic components just hit an all-time high! If this is not the picture-perfect definition of pushing on a string I just don’t know what is! What the figure below is telling us is that Bernanke is going to have to throw larger amounts of money than he has in the past just to get the same economic result. Ergo, to be effective the eventual passing of QE3 needs to be even larger and more grander than QE1 or QE2!

Source: The Conference Board
Given the lack of passthrough from the monetary components into the economic components of the LEI, the overall LEI is now highly misleading while the economic LEI has proven to be far more reliable in determining the health of stock markets trends. Currently we are seeing a negative divergence between the economic LEI and the S&P 500’s growth rate. When was the last time we saw such a divergence? You guessed it, 2007—just as the economy was beginning to slip into a recession.

Source: The Conference Board
While Bernanke will have to throw more money at the system with QE3 than he has with his prior salvos of money printing, does he have the political capital to do so? THAT is the key question of the moment. I bring this up as Bernanke received a fair amount of flak for QE2 which actually saw bond yields RISE rather than fall as was the plan and also witnessed commodities surge and the USD plunge. When originally asked if QE2 worked, Bernanke side-stepped the comments on commodity inflation and instead cited the rise in stock prices as proof QE2 was working. Yes Mr. Bernanke you were effective at influencing the monetary components of the Conference Board’s LEI, of which the S&P 500 is one of them, but you did absolutely nothing to stop the slowing economy as the economic LEI continued to slow throughout the duration of QE2 and continues to slide currently. Thus, while the stock market soared on cheap dollars, there was very little rebound in overall economic growth and certainly no improvement in the financial situation for the average American. According to the Pew Research Center (bottom portion), there has been absolutely no improvement in the financial challenges the U.S. consumer faces.
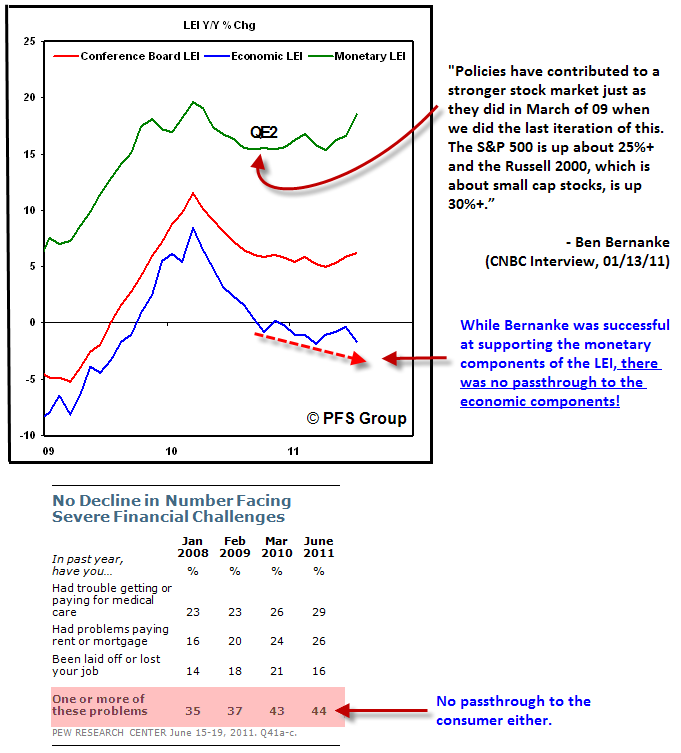
Source: The Conference Board, Pew Research Center
Click here to enlarge
Economic Models Break Down During Deleveraging Cycles
One other point to bring up is the third largest weighting in the Conference Board’s LEI—the yield curve, carrying a 10.5% weight. Most economic models incorporate the yield curve for economic and recession forecasting as it has traditionally been a great leading indicator of a recession as we typically see an inverted yield curve well in advance of a coming recession. However, when the yield curve is intentionally being manipulated by a central bank, how reliable is it? I bring this up as many economists and financial pundits are using the positively slopped yield curve in the U.S. to argue against a recession. Quick question, how many times has the Japanese yield curve inverted since their secular bear market began in the late 1980s? Answer, NEVER!
This point is brilliantly brought up Francois Trahan from Wolfe Trahan & Co. who points out historical economic models are broken and tears apart the lack of independent outside-of-the box thinking that is so needed today. Below is a chart Francois put together to show this very point that in a debt deleveraging cycle and with central bank intervention, conventional wisdom breaks down.

Source: Francois Trahan, “Hunting For Clarity In The Era of Uncertainty.” (08/01/2011)
Click here to enlarge
For anyone interested in reading more work from Francois who goes against the grain by discarding out-dated economic models, I would highly suggest you read his book that was just released.
The Era of Uncertainty: Global Investment Strategies for Inflation, Deflation, and the Middle Ground

Summary
Given how poorly the economic releases have been over the last month and the sharp decline in the stock market, it should be clear to any objective observer that we are going through more than a “soft patch” as Fed Chairman Bernanke and the blissfully bullish media talking heads maintained. The economy is clearly slowing down and at high risk of rolling into a recession this year and we can expect monetary and fiscal policy to come. Bernanke has already launched two rounds of quantitative easing and given QE2 only seemed to cause asset reflation with higher stock and commodity prices while doing very little for the economy, he will not likely be able to launch a huge monetary bazooka in the form of QE3 in the near term. Rather, he will likely initiate QE3-lite until the Fed hawks disappear like the environmentalists did in 2008 when we had 5/barrel oil and “DRILL BABY DRILL” was all the rage. Eventually economic growth will be poor enough for all to see and the slogan of the day will be “PRINT BEN PRINT!” Given we have been getting less economic bang with each buck printed, my guess is that most will be shocked at the amount that Ben will have to print to right the economic ship as he has been pushing on a string for some time now.
Again, given inflation is still in the process of peaking and economists are still calling for a second half rebound in GDP, he will likely have to go slow until all Fed dissenters dissipate when unemployment jumps north of 10% again and the economy is firming in a recession. Speaking about a coming recession, the Chicago Fed National Activity Index comes out on Monday and is a must read report. We are typically in a recession when the three month moving average slips below -0.70. June’s reading came in at -0.60 and we are hanging on by a thread. If July’s reading released on Monday comes in below -0.70, there will be no recessionary alarm bells left in my book, just a recessionary fire.
 Source: Bloomberg


