


Since the S&P 500 bottomed at 1820 on October 15th, it is up roughly 12.5% and has seen only 6 down days in the last month. According to trading desks, steady growth in the U.S. and China, better-than-feared European economic data, and accommodative global central banks are the main causes for driving the market higher. Other bullish supports are an increase in foreign buying of U.S. equities and corporate buybacks (see here). While I think the above mentioned trends plus the bullish historical tendency of the market to rally into year-end are at play, I am seeing some divergences in the credit markets that suggest a pause or small pullback may be in the offing before the markets rally further.
Credit Markets
One of the best indicators this year in raising the red flag before a pullback has been the junk bond (AKA: high yield) market. Shown below is the Barclays U.S. Corporate High Yield Average Option Adjusted Spread (OAS) inverted for directional similarity along with the S&P 500. The OAS spread began to tick higher before the June/July and the Sept/Oct pullbacks as seen by the yellow highlighted boxes. Currently we are seeing the OAS spread tick higher again, warning that the markets latest advance into new high territory is upon shaky ground.

Source: Bloomberg
Other signals echoing caution are credit default swaps (CDS) on investment grade (blue line below) and high yield (red line) corporate bonds shown below in the bottom panel, inverted. You can see that whenever there is a divergence with corporate bond CDS and the S&P 500 over the last year the S&P 500 tends to play catch up within a few days or weeks. Like the OAS spread, the CDS on corporate bonds is heading higher (lower in chart) and suggests we could see a bout of profit taking in the stock market.

Source: Bloomberg
Confirming the message above as well is Bloomberg’s U.S. Financial Conditions Index, which is a credit composite of spreads from the money market, U.S. corporate and muni bond markets, and the equity market. It serves as a pretty good read on U.S. financial market health. The index generally tracks the movement of the S&P 500 but, when it diverges, typically it’s the stock market that eventually adjusts and not the other way around (see red regions below). As you can see, the current divergence is quite large.

Source: Bloomberg
Market Breadth
We are also seeing another case of Bob Farrell’s rule number 7, which says that “markets are strongest when they are broad and weakest when they narrow to a handful of blue-chips.” Prior to the pullbacks we’ve seen over the last year we begin to see fewer stocks making 4-week (2nd panel), 12-week (3rd panel), and 52-week (4th panel) new highs as shown below even while the market powers higher. Breadth typically deteriorates prior to a pullback as these examples highlight and we are seeing another case where new highs are contracting while the market is expanding.

Source: Bloomberg
The decline we are now seeing in market breadth can be interpreted in two ways: The first and more bullish view is one of sector rotation where leaders become laggards and laggards become leaders so that net new highs contract. The second and more bearish view is that we are seeing genuine deteriorating breadth as the number of leaders fade without new stocks and sectors to pick up the reins and pull the market higher, which is the case before a pullback. Given the deterioration in the credit markets recently, I believe the latter is the case and a small pullback may be around the corner.
Economic Data
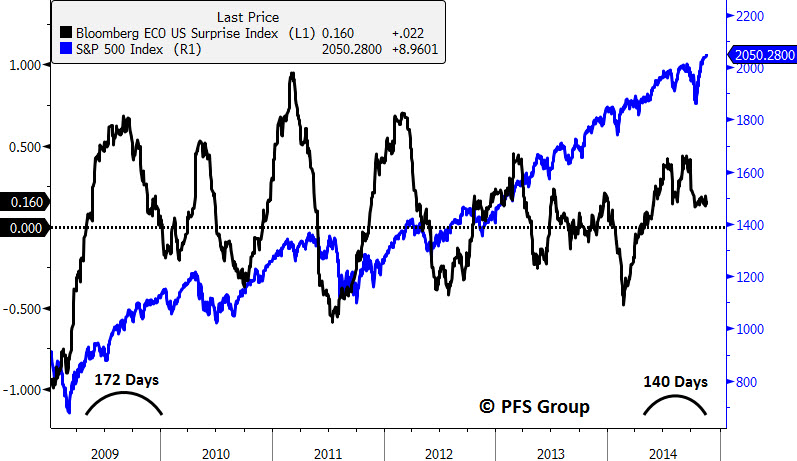
That said, I would not expect Armageddon given the economic backdrop. U.S. economic reports have been consistently surprising to the upside as measured by Bloomberg’s Economic Surprise Index, which measures the percentage of releases surprising forecasts. We are currently seeing the second longest streak of positive surprises since the recession ended in 2009. After the recession ended, the Bloomberg Economic Surprise Index remained in positive territory for 172 days before it went negative for several months. Recently, the index has been in positive territory for 140 days, which is the second longest streak since 2009 as the U.S. economy continues to surprise most economic projections.
Source: Bloomberg
Labor Markets
U.S. labor markets continue to improve as well with job openings reaching a multi-decade high recently, which is positive for overall nonfarm payrolls as the index leads by roughly half a year and suggests payrolls should expand well into 2015.

Source: Bloomberg
Other indicators support the call for continued payroll gains heading into 2015 like the yield curve (green line below shown advanced) and the Fed’s Senior Loan Officer Survey (red line, shown inverted and advanced). Both series tend to lead payroll growth, as you can see below.

Source: Bloomberg
In relation to payroll growth, leading indicators point to a further drop in the unemployment rate heading into 2015. One useful indicator that gives a 3-4 month lead time is the National Federation of Independent Business (NFIB) survey of small businesses, particularly the section "Poor Sales". Small businesses cite it as their single most important problem and the fact it ticked down to the lowest level since early 2008 suggests the unemployment rate should fall at least into the spring of 2015 (see green box below).

Source: Bloomberg
Falling Gas Prices Good for Consumers, Retail Sales
In addition to an improving labor picture is the tailwind to the economy from falling gas prices. Bloomberg economists Josh Wright and Carl Riccadonna have estimated the annual gas costs to U.S. consumers, which I've illustrated below. Back in 2011 we were spending roughly 00 a year on gas. With the recent collapse, that has fallen nearly 0 to the lowest annual costs since late 2010 and roughly yields 5 billion stimulus to the U.S. economy.

Source: Bloomberg
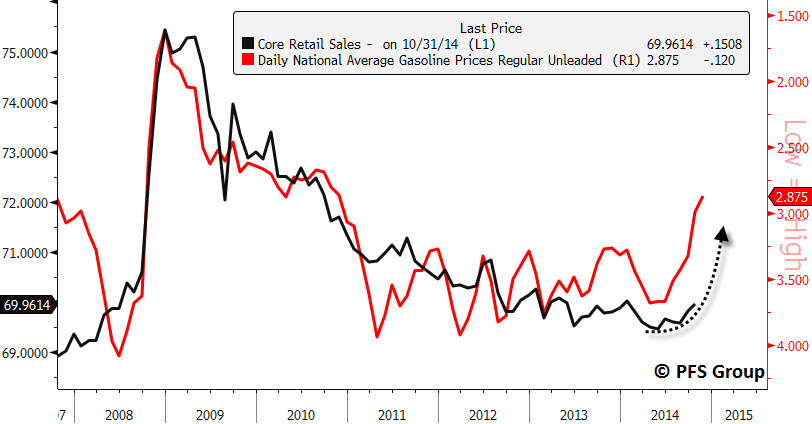
The less consumers spend on gasoline the more they have to spend on discretionary items, which is why we see core retail sales (sales less autos and gasoline) as a percentage of total retail sales pick up when gasoline prices turn down. This dynamic is shown below with core retail sales as a percentage of total sales in black and the average national gasoline price shown in red and inverted. The sharp drop in gasoline prices should translate into more discretionary dollars for consumers during the holiday shopping season.
Source: Bloomberg
Summary
The U.S. stock market has displayed a strong rally off the October lows and has seasonal tailwinds at its back. However, near-term caution may be advised since we are starting to see some negative divergences in market breadth and the credit markets, suggesting a pause or pullback may be in the works. Given the current strength of U.S. economic data, I do not expect a major correction to occur as the string of positive economic surprises are enjoying their greatest length since the first moves out of the 2007-2009 recession. Payrolls are expected to expand further and the unemployment rate should also contract well into 2015. The sharp decline in gasoline prices is translating into a roughly $500/year tax break to the average driver, boosting discretionary incomes right before the holiday season. Thus, while investors should exercise some near-term caution, do not get overly bearish as I believe the stock market is likely to head higher after a pause.


