


Overview:
- Measures of credit stress are rising which historically spells trouble for stocks
- Most pronounced pickup in stress is in junk bonds
- Also seeing stress in currency and US Treasury markets
- Outside of these areas, credit markets remain calm
One of the biggest themes strategists were calling for in 2015 was a pickup in volatility. The main reason given was the U.S. Fed turning from a tailwind to a headwind as it first removed quantitative easing (QE) and then seemed bent on raising interest rates this year. Given the sensitivity of the stock market to monetary policy a call for greater volatility seemed like a sure thing.
Often associated with rising levels of volatility is greater financial stress and, as I show below, we’ve clearly seen some deterioration in widely followed credit indices. It’s important to follow the credit markets as they can often provide an early warning of a coming stock market correction and/or bear market. To show you how important tracking the credit markets is let me run through a few examples.
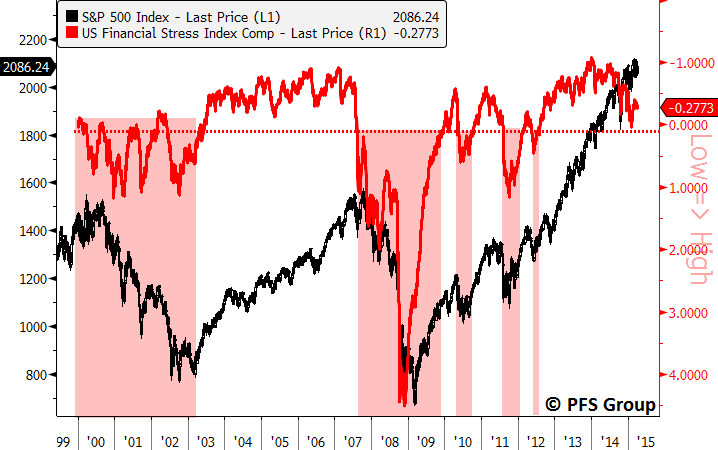
The biggest early warning provided by the credit markets in recent memory came during the 2011 Greek debt crisis and U.S. ratings downgrade. The US Financial Stress Index composite I created (an equally weighted composite of 7 different stress indices) peaked in the middle of February 2011 and deteriorated well before the May 2011 top (see red shaded box on the left below). Also, the market staged a recovery rally in August going into September but the Stress Index Composite kept heading south (red shaded region in middle figure below) as credit conditions continued to erode. Eventually, the market headed south as well until both bottomed later in September. (Note - Financial Stress Composite showed inverted for directional similarity).

Source: Bloomberg
Going back to the 2007-2009 bear market clearly shows how monitoring the credit markets can serve investors well. The Financial Stress Index Composite peaked in February 2007 and deteriorated throughout the rest of the year even though the S&P 500 went on to hit new all-time highs in October 2007 (red shaded region below). Similarly, the credit markets bottomed in late 2008 well before the March 2009 bottom (green shaded box) and gave investors an early warning that a new bull market was forming.

Source: Bloomberg
Now that we’ve seen how helpful the credit markets can be in signalling trouble let’s take a look at their current message. As you can see from the chart below, it would appear we are seeing another warning message. My US Financial Stress Index Composite peaked in early 2014 just as QE3 began to be wound down by the Fed. Conditions began to erode materially during the October correction and briefly turned positive in early 2015 (shown inverted on the right panel, positive numbers are bad while negative numbers are good).

Source: Bloomberg
Looking into the details of various credit spreads measured by these financial stress indices shows that much of the deterioration we are seeing stems from the erosion in the junk bond market, particularly junk bond spreads to comparable US Treasuries. This can be seen when looking at Barclays US Corporate High Yield (AKA: Junk Bonds) Average Option Adjusted Spread (OAS), which is shown inverted below. The OAS began to widen in the middle of 2014 and turned up sharply later in the year and has since come off its highs but still remains elevated relative to its year-ago levels.

Source: Bloomberg
While it’s true that OAS spreads have widened recently there is no cause for alarm. I say that because spreads are currently below their long-term average of 5.68% and it’s only when spreads widen beyond that level that large nasty corrections and bear markets occur (see red circles below).

Source: Bloomberg
The widening in spreads recently would tend to suggest that the market is pricing in a greater risk of default in the junk bond market. However, a truer measure of the risk of default in the junk bond market that isn’t relative (as Treasury yields can be distorted) is looking at credit default swaps (CDS). I would be worried if CDS for junk bonds were blowing out in conjunction with a blowing out of the spread to Treasuries but that isn’t occurring. CDS on junk bonds (red line) is resting near the lows seen over the last 3 years (shown inverted) as are CDS for investment grade bonds (blue line). While they are slightly off their best levels they still aren’t showing large amounts of stress.

Source: Bloomberg
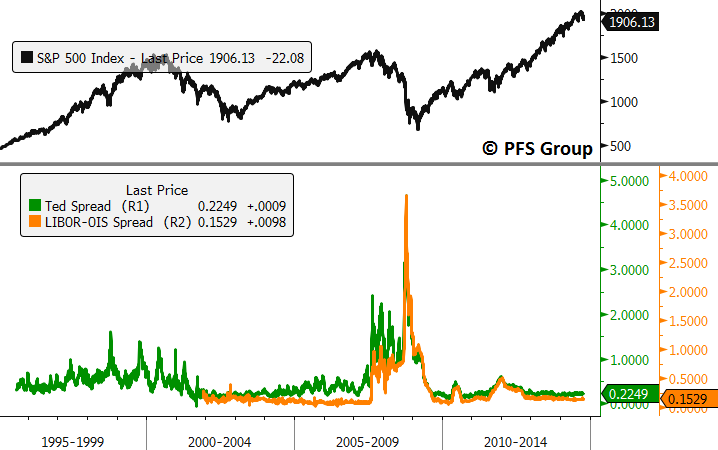
Looking at other major spreads like the Ted Spread or LIBOR-OIS spread shows virtually no stress in the system:
Source: Bloomberg
Other spreads are near all-time lows like long-term USD currency swaps which typically rise for years prior to a recession.

Source: Bloomberg
Again, I think most of the erosion in these credit indices comes from junk bond spreads, but given CDS for junk bonds remains tame I think it is partly due to low UST yields given the decline seen globally and strong USD that is making our bond market attractive. If the stress in the junk bond market was about to become unglued and lead to contagion in other areas I would be concerned about the iShares iBoxx High Yield Corporate Bond ETF (HYG) and the SPDR Barclays High Yield Bond ETF (JNK) rolling over; however, when we look at each of those, that is not the case and they appear to be stabilizing.
Also, investors would be running for the hills if the junk bond market was about to implode and instead we saw the largest average 20-day inflows to HYG ever recently (red line, middle panel below) and because of that total cumulative flows into HYG are now just coming off all-time highs and eclipsed their 2012 levels (3rd panel below).

Source: Bloomberg
Besides the general increase in junk bond spreads, which I believe is reflective of the low yields in the US Treasury market given CDS for junk bonds aren’t blowing out, one additional source of rising stress shown in some credit indices comes from increased volatility in the currency and US Treasury markets. Using the Euro/USD one month implied volatility index as an example shows how much currency volatility has picked up in the last year. EUR/USD volatility is at its highest level since the 2011 and 2012 European debt crisis (blue line, bottom panel below). We are also seeing greater volatility in the Merrill Lynch Option Volatility Index (MOVE), which measures volatility in the U.S. Treasury market and is at its highest level since the 2013 “taper tantrum” (red line, middle panel below). Interestingly, the volatility in the US Treasury market and currency markets has not spilled over into equities as measured by the S&P Volatility Index (“VIX”) shown in the top panel below.

Source: Bloomberg
The volatility in the currency markets is understandable given the diverging global central bank policies in which the U.S. Fed has a tightening bias while Europe, Japan, China, and other emerging and developed central banks have an easing bias. However, the volatility in the currency markets has not spilled over into domestic measures of credit stress outside of the junk bond market.
While there is presently no general cause for alarm in the credit markets, investors need to be on alert to watch for a spillover of stress from the Treasury and currency markets into general measures of credit stress. Should stress begin to rise in other domestic credit areas outside of the junk bond market it may be time to start moving to a defensive stance, particularly should my U.S. Financial Stress Index Composite move above its long-term average (shown below inverted). Bad things occur when this happens like the bear markets in 2000-2003 and 2007-2009 in addition to the large 2010, 2011, and 2012 corrections.
Source: Bloomberg
Summary:
Financial commentators have recently been highlighting the deterioration in financial stress indices. This is noteworthy given their tendency to lead equity markets, however, digging into these stress indices highlights that much of the stress they are showing is coming from widening spreads in junk bonds relative to US Treasuries. This makes sense given that global bond yields are falling relative to higher yielding US Treasuries, which drives our Treasury yields lower. This in turn causes spreads with junk bonds to widen which in isolation could be viewed as rising default risk but when measuring pure measures of default risk like credit default swaps shows that default risk has not risen materially.
Another source of rising stress in various credit indices comes from increased currency market volatility, which is understandable given divergent central bank policies. So far these pockets of rising volatility and stress remain isolated as other widely followed stress measures like currency swaps, the Ted spread, and the LIBOR-OIS spread remain calm.
We are either going to see these pockets of stress begin to ease or see a spillover of stress into other credit areas. This should be monitored by looking at individual credit measures as well as financial stress indices as further credit deterioration could be warning of a corrective phase in equities. While I am presently not seeing credit stress contagion from the currency and junk bond market into other areas of credit, should further erosion occur I’ll be sure to keep readers apprised.


