


In many parts of the country gasoline prices are over $4/gallon and consumers across the nation have taken note of the recent spike. Associated with the recent spike in gasoline and oil prices have been a surge in news articles suggesting the economic recovery that began last fall may stall and so too the recent market advance. However, it is not the absolute price level that constitutes an energy shock but a sharp spike in energy prices over a short time period. It is because the recent rise has not reached “shock-like” magnitude that the economy and market are likely to continue their advance. The reasons cited below are: seasonal rate of change, sentiment, market relationships (particularly between the retailing, consumer discretionary, and energy sector), and, lastly, market breadth.
Energy Seasonality Suggests Rise Is Normal
Gasoline prices rise throughout the first half of the year as the summer driving season approaches and then spend the latter half of the year falling. As shown below in a seasonal chart of gasoline prices, while we are currently above the 5-year high for this time of year, the overall path of gasoline prices this year has been normal.

Source: Bloomberg
While gasoline prices have hit /gallon early on in the year, they also entered the year at higher levels than in previous years and the annual rate of change so far is not of out the ordinary. Over the last five years the peak in the annual rate of change (ROC) for gasoline prices usually occurs near the end of May to early June at roughly 27% whereas the current annual ROC in gasoline prices is still well below that level with a current reading of 14%. If gasoline prices rise close to the normal annual ROC in May of 25%, given the /gallon level seen in May of 2011, that would correspond to /gallon gasoline this summer. Again, even if we hit /gallon gasoline by summer this would still be ENTIRELY NORMAL in terms of a seasonal annual ROC.

Source: Bloomberg
The important point to remember is that consumers adapt and they can absorb gradual and normal price changes; it is the rapid and abnormal price changes that cause consumers to pull back. For example, who is currently freaking out about movie tickets that cost more than or stamps over __spamspan_img_placeholder__.40? We as consumers have adjusted over time to these higher prices that have resulted from consistent annual inflation just like we adjust to a rise in energy prices over time. It takes rapid spikes in a short time period to bring about significant changes in consumer habits. If the recent rise in oil and gasoline prices was such a shock we would see this reflected in the media. Sure we are seeing more news stories, but nothing like what was seen in 2008 or 2011 which were the two most recent energy shocks. The figure below highlights the weekly news stories in Bloomberg that had “oil prices” within them and you can see that we are nowhere near the levels of 2008 or 2011.

Source: Bloomberg
Market Indicators Also Suggests We’ve yet to Witness a True “Energy Shock”
The current worry for investors is that the rise in oil and gasoline prices will hurt the consumer and cause a retrenchment in spending. Given consumption makes up more than 70% of the economy, this is certainly a valid concern but if US consumers were retrenching would the S&P 500 Retailing Index be at an all-time high?
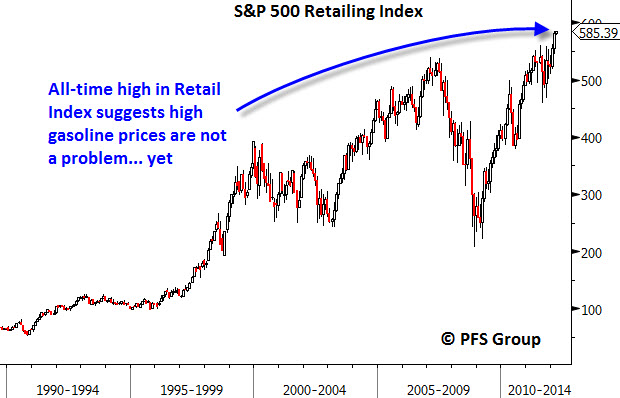
Source: Bloomberg
The reason I bring this up is that the market often provides excellent early warnings as to when we reach a tipping point with high energy prices and so monitoring various sector relationships can give investors insight into when to expect a consumer retrenchment and thus an economic slowdown.
To illustrate this point, monitoring the consumer discretionary sector relative to the energy sector not only highlights when we reach an energy tipping point, but also reveals this information well before a major market peak. A perfect example of this was the situation in 2007 in which oil prices bottomed and then nearly doubled over the course of a year. Again, energy shocks constitute rapid increases over a short time period, and a near doubling in price over twelve months would certainly meet this criteria. The energy shock of 2007 clearly played out in the stock market as the consumer discretionary sector relative to the energy sector (red line in top panel below) began a steep decline right as oil prices bottomed (lower panel below) and began a steep incline. Also of note, the peak in the consumer discretionary versus energy sector occurred more than six months before the stock market peaked (S&P 500 black line in top panel) and provided an early warning that inflationary pressures would take their toll on the economy and stock market.

Source: StockCharts.com
A more recent example occurred last year where we witnessed the same dynamic of rapidly rising energy prices perfectly coinciding with the consumer discretionary sector’s poor relative performance to the energy sector. Like 2007, the peak in the consumer discretionary sector relative to the energy sector occurred well before the peak in the stock market as did its bottom later in the year which occurred prior to the market’s October 2011 bottom.

Source: StockCharts.com
Flash forward to today and despite the rise in oil and gasoline prices the consumer discretionary sector relative to the energy sector is hanging in there and more or less trading sideways. Once the relative performance between the two sectors drops off sharply that will be the time to worry, but that time is not now.

Source: StockCharts.com
A quick look at market internals for the S&P 500 also shows that the negative affect of high energy prices are not causing any pain yet. If gasoline prices were set to stall the economy and stock market we wouldn’t be witnessing an all-time high in the S&P Retailing Index and the consumer discretionary sector would not be the market’s strongest sector. Shown below are the percentage of stocks within each sector that have made a 52-week high over the last month and wouldn’t you know it, the consumer discretionary sector is the strongest sector with 44% of its members making a new 52-week high in the last month. Interestingly enough, the energy sector is one of the weakest sectors with only 16% of its members making new 52-week highs in the last month.
Regardless of looking at specific sectors, just look at what the message of the following chart is telling us where 26% of the 500 stocks within the S&P 500 have made a new 52-week high in the last four weeks. Outside of the telecommunications sector (which only has 7 members) every sector has good participation with the percentage of their members hitting new 52-week highs in double-digit territory.

Source: StockCharts.com
Equally important is the lack of downside participation of stocks hitting new 52-week lows. If energy prices were significantly impacting the economy we would also see a negative impact to the stock market with stocks rolling over and making fresh 52-week lows. Look at the figure below and how it is the polar opposite to the new 52-week high figure above. Only 1% of the S&P 500 has made a new 52-week low over the last month. I submit that while the threat of an energy shock remains possible, particularly with Iran, the message of the market is clearly saying this is not impacting the market nor economy as of yet.

Source: StockCharts.com
Summary
While high energy prices could certainly derail the economy and stock market ahead, investors should not run for the hills as the fingerprints of an energy shock are clearly absent as of now. That said, the threat of a shock is real and I would suggest watching three indicators to gauge this threat ahead which have all been highlighted above. They are the following:
- The absolute price level of the S&P Retail Index (XRT)
- The ratio of the consumer discretionary sector to the energy sector (XLY/XLE)
- Market statistics for new 52-week lows and highs


