


Summary:
- Global stock markets lost over $5.5 trillion in value during recent sell off.
- Central bankers took to the speaking circuit to arrest the market decline.
- Fear readings and oversold conditions last seen in 2011.
- Strength of current bounce to help settle bull and bear debate.
- Several supports argue for near-term bullish outlook.
Over $5.5 trillion in value has been erased in global equities since they peaked in September and stabilized last Wednesday. The S&P 500 lost nearly 200 points with the Dow shedding nearly 1500 during the correction. Commodities took a nosedive as well West Texas Intermediate Crude, which fell nearly $28/barrel from a high of $107.73 in June to $79.78 last week. Selling climaxed when the Dow fell over 450 points last Wednesday; though panic selling quickly turned into panic buying as selling pressure was exhausted.

Part of what helped arrest the market decline was a culmination of widely telegraphed accommodative statements by central bankers across the globe. First we heard from Federal Reserve Bank of Chicago President Charles Evans who said the following on October 13th:
Fed’s Evans: Biggest Risk to U.S. Now Is Premature Rate Hikes
“History has not looked kindly on attempts to prematurely remove monetary accommodation from economies that are in or near a liquidity trap,” Mr. Evans said in a speech to a local group in Indianapolis.
“If we were to presume prematurely that the U.S. economy has returned to a more business-as-usual position and reduce monetary accommodation too soon, we could find ourselves in the very uncomfortable position” of having just raised rates off of near-zero levels, having to lower them in short order, the official said…
Speaking with reporters after his speech, Mr. Evans reiterated that he believes the Fed should likely hold off until the first quarter of 2016 before raising rates, as long at economy performs as expected…
The next day we heard from San Francisco Federal Reserve Bank President John Williams who said the following in an interview with Reuters:
More QE might be appropriate if economy faltered: Fed's Williams
"If we really get a sustained, disinflationary forecast ... then I think moving back to additional asset purchases in a situation like that should be something we should seriously consider," Williams said in an interview with Reuters.
Just two days later after the sharp swoon on Wednesday the 15th, St. Louis Federal Reserve Bank President James Bullard said the Fed should delay ending QE in an interview with Bloomberg:
Bullard Says Fed Should Consider Delay in Ending QE
“Inflation expectations are declining in the U.S. …that’s an important consideration for a central bank. And for that reason I think that a logical policy response at this juncture may be to delay the end of the QE…”
“We are watching and we’re ready and we are willing to do things to defend our inflation target,” Bullard said… A pause in tapering would protect against “downside risk” and bolster inflation expectations, he said. “We could react with more QE if we wanted to.”
Not to be left out of the market cheerleading party, our counterparts across the Atlantic chimed in on Friday to support their markets as well, starting with the Bank of England’s Chief Economist Andrew Haldane:
BOE Official Says Rate Could Stay ‘Lower for Longer’
The Bank of England’s Chief Economist Andrew Haldane said Friday he is “gloomier” about the outlook for the U.K. economy than he was three months ago, and believes the benchmark interest rate can remain “lower, for longer” without pushing the rate of inflation above the Monetary Policy Committee’s 2% target.
Also out on Friday were comments from ECB Executive Board member Benoit Coeure:
ECB's Coeure sees euro zone growth in third, fourth quarter
Speaking to reporters at a conference hosted by the Bank of Latvia in Riga, Coeure repeated the ECB's line that its Governing Council is "ready to take additional non-conventional measures, if needed…"
Turning to the ECB's latest plans to buy private sector assets, he added: "We will start within the next days to purchase the assets that are foreseen under our new purchase programs, with the objective to steer the balance sheet of the ECB to a higher level."
We also learned this week that the ECB may broaden its asset purchases to corporate bonds, which sent stocks across the globe higher on Tuesday the 21st. An excerpt from a Reuters article highlights the development:
ECB looking at corporate bond buys, could act as soon as December
The European Central Bank is considering buying corporate bonds on the secondary market and may decide on the matter as soon as December with a view to begin purchases early next year, several sources familiar with the situation told Reuters.
European shares rallied on the news, led by banks and shares in peripheral countries. The euro fell more than half a cent against the dollar and credit indices tightened sharply.
Policymakers are desperate to revive the euro zone economy, which is barely growing and dogged by low inflation of 0.3 percent, far below the ECB's target of just below 2 percent.
The comments from global central banks helped to arrest a brutal decline that drove sentiment to bearish levels not seen in years. CNN Money’s Fear & Greed Index, which measures sentiment on a scale of zero (extreme fear) to 100 (extreme greed), actually hit zero last week and currently rests at 5:

Source: CNN Money
The historical chart for the index shows last week’s readings were the lowest in two years as investors’ risk appetites evaporated:

Source: CNN Money
Other signs of extreme fear often associated with market bottoms comes from the futures curve for the CBOE Volatility Index (VIX). Typically the futures curve for the VIX has a positive slope meaning 4-month futures values are higher than near- term contracts like 1-month futures. When investors panic they are willing to pay a premium for nearer term contracts and the curve can invert in which near-term contracts are more expensive than longer-dated contracts. This happened last week when the 4-month futures contract was less than the 1-month contract with the biggest spread seen since the mid-summer 2011 lows.

Source: Bloomberg
Other signs of selling capitulation come from the National Association of Active Investment Managers (NAAIM) Exposure Index, which represents the average exposure to US equities reported by their members. Heading into 2014 the index was at roughly 100 (fully invested). Now the index stands near 9.97%, which means the average manager is either nearly 100% in cash or hedged or market neutral. The current reading is the lowest figure seen since the mini bear market during the middle of 2011 and exceeds the reading seen at the 2010 market bottom.

Source: Bloomberg
For evidence that managers cut their allocation to the stock market one has no further to look than the Powershares QQQ, which indexes to the NASDAQ 100. The ETF's average daily outflows over the last 20 days were over 6M—the largest average daily outflow seen in more than a decade (middle panel below) and wiped out three years of inflows, which are now back to 2011 levels.

Source: Bloomberg
So Bearish It’s Bullish?
The extreme readings we are seeing in sentiment figures and the widespread liquidation of stocks have pushed many measures of market breadth to their worst levels in years. For example, last week we saw the percentage of stocks within the NYSE that are trading above their 200-day moving average reach 30%—a feat not seen since 2011 and one that occurs only every few years.

Source: Bloomberg
Whether you are currently bearish or bullish on the market, investors should respect the market’s forward returns when breadth is this bearish. In bull markets, readings at or below 30% serve as major buying opportunities to put fresh capital to work while in bear markets they serve as opportunities to sell into a rally and raise cash further.
Looking ahead, it will be important to watch for tell-tale signs of when the current bull market is losing momentum and ready to enter another bear market. One way to do this is by watching how high the percentage of stocks above their 200-day moving average rises before the next sell off. Looking above we can see that dips near 30% in bull markets quickly reverse and rise well above the 50% mark while in bear markets the 50% level is rarely breached. The last time we dipped below 30% was in 2011 and by early 2012 the number had jumped north of 20% as the bull market carried on.
In the last bear market the percentage above their 200-day moving average fell below 30% for the first time in January of 2008. The markets experienced an oversold spring rally before peaking in May with the percent above their 200-day moving average only making a feeble bounce to 41%. Throughout the 2007-2009 bear market, stocks never saw the percentage of NYSE members above their 200-day moving breach the 50% mark until the March 2009 bear market bottom was in. An important watch-point going forward to gauge whether we just experienced a bull market correction or the kick off to a bear market will be to see if the percent of NYSE members trading above their 200-day moving can breach the 50% threshold.
Similar to the breadth measure cited above is the McClellan Summation Index. The Summation Index is a running total of the McClellan Oscillator, which is another way to measure market breadth. In bull markets, breadth is strongest and signs of a bear market occur when breadth weakens as fewer stocks participate in the bull market. Looking for signs of market breadth deterioration is a helpful clue to gauging whether the market is in a bull or bear market. Typically during market rallies the Summation Index rises above +500 but near a bull market top when breadth weakens peaks occur below 500. We saw this leading up to the 2000 and 2007 top (see red circles) and all of the counter-trend bear market rallies fell short of the +500 level to indicate the bear market was still alive.
NOTE: Readings north of 500 between 2001-2002 occurred when the market stabilized and the recession of 2001 was nearing its end. The equal weighted S&P 500 did much better than the S&P 500, which, in 2000, was nearly 30-35% technology stocks. So from 2001-2002 the market was improving until fears of another Persian Gulf War late in 2002 pushed the market over the edge until it bottomed after the first missiles were fired.
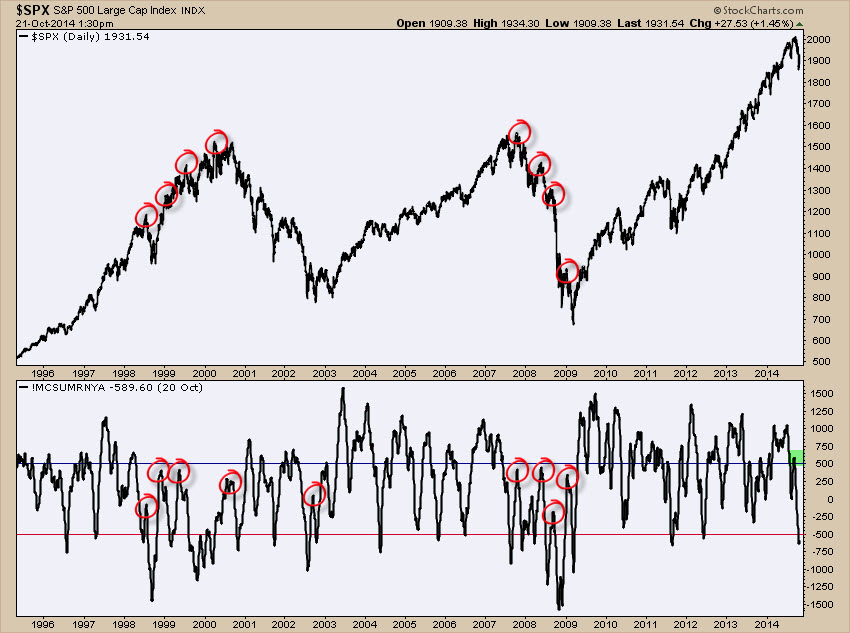
Source: StockCharts
The September peak saw the Summation Index push close to 600 and it more than cleared the +500 level, which is bullish. What we need to see now is where the next short-term peak in the Summation Index occurs when the market begins to stall. Should it peak below the +500 level that would be a big bearish red flag and suggest we are moving into a new bear market. However, should we again move north of +500 the market needs to be given the bullish benefit of the doubt.
Some Fodder for the Bulls
There are some supports for the bull camp for the coming months as the markets may continue to rally. Most corporations are precluded from buying back their shares during the five weeks before their earnings release and so the month before the onset of earnings releases typically show the lowest percentage of share buybacks seasonally. Peak earnings releases for the S&P 500 will be between October 13th and October 31st, which is significant as four to five weeks prior the S&P 500 peaked as a major buying source of the market dried up. Near the end of this month roughly 75% of the S&P 500 companies will have reported and will be able to restart their share buyback programs. According to Goldman Sachs data going back to 2007, roughly 25% of annual share repurchases occur in the last two months of the year with November being the largest month (14% of total annual share repurchases). This indicates corporations may be a significant marginal buyer of the stock market beginning in the next few weeks.
Wall St Week Ahead - Beyond earnings, buybacks to give market support
"We are now in a blackout period so companies have been precluded from conducting tactical buyback activity that has supported the equity market during sell-offs in the recent past," said Goldman Sachs in a note earlier this week.
October has been particularly quiet for buybacks by U.S. companies, with about .7 billion in stock repurchases announced or completed so far this month, compared with about 0 billion during the first nine months of the year, according to Thomson Reuters data…
"Next week is one of the busiest we have, so that unlocks a lot of buyback programs after that's over," said Art Hogan, chief market strategist at Wunderlich Securities in New York.
He said the impact of those post-earnings buybacks has been consistent in the past years as "companies have been buying stock pretty aggressively."
Another potential liquidity support for the market comes from global central banks. I created a proxy for global money in USD-terms and there has been a pretty strong correlation with the stock market since 2009 as seen below.
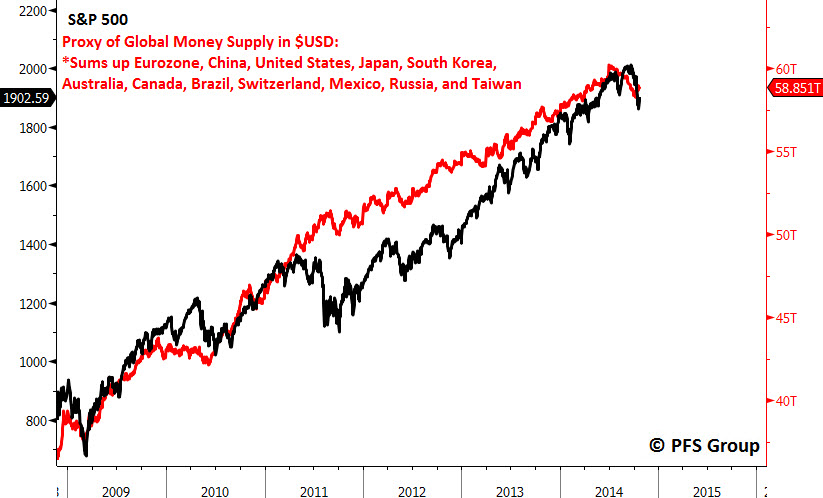
Source: Bloomberg
My global money supply proxy began to dip sharply in the middle of August a month prior to the decline in the S&P 500 and it also led on the upside, bottoming in early October and rising sharply higher. Should global money supply drift higher in the weeks ahead stocks should find some support.
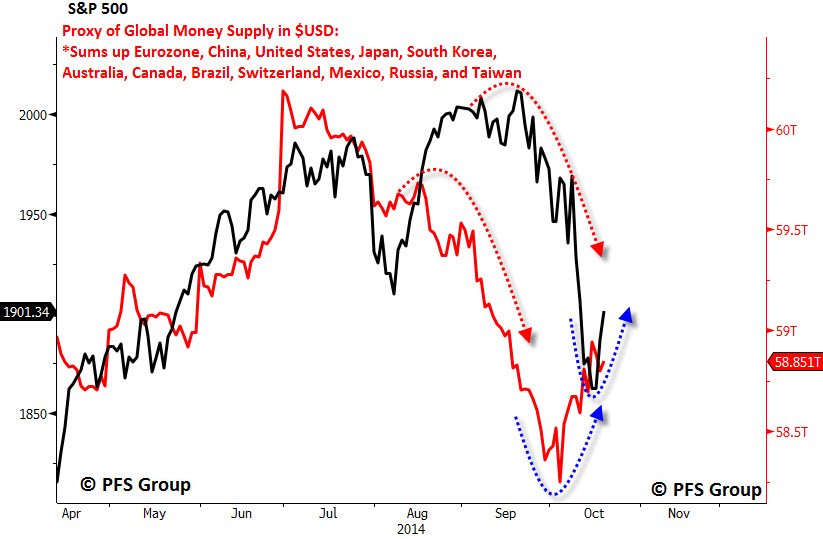
Source: Bloomberg
Additional support for the economy and consumer comes from the slide in gasoline prices. Over the last two months the national average gasoline price fell by nearly 10%, a level often associated with market bottoms as consumer spending and confidence pick up.

Source: Bloomberg
One additional source of strength for the bulls in the coming weeks could be a pickup in positive economic surprises. Typically breakeven inflation rates lead economic surprises by several months and indicate that the decline in inflation expectations (shown inverted in red below) should mean economic releases from now through the end of the year should tend to surprise to the upside.

Source: Bloomberg
Summary
Global stock markets took a nosedive since the middle of September as buybacks by US corporations went on hiatus and global money supply shrank sharply leading into the market peak. Lots of technical damage was done in which markets reached elevated fear levels and severely oversold conditions, which made the markets prime for a short covering bounce. This was also helped along by accommodative statements from global central bankers.
How the markets behave in the coming weeks will go a long way to help determine if the September-October correction was the start of a new bear market or just a normal correction in a bull market. There are some supports for the bulls for a decent year-end rally as the blackout period for share buybacks will be lifted and the last two months of the year are the strongest two month period for buybacks. Additionally, global money supply is rallying again and should lend some liquidity support to the markets. The recent plunge in gasoline prices will also prove to be a support for the consumer and overall consumption trends, and the decline in inflation expectations argues for positive economic surprises into year-end.
Given the lack of deterioration in leading economic indicators and lack of severe stress in the credit markets, the bulls should be given the benefit of the doubt until proven otherwise. Should the current rally fizzle out and the markets head south even in the face of bullish supports, the bulls will have to re-examine their thesis.


