


The S&P 500 rallied more than 1% today spurred by the release of a strong jobs report for November and was able to close above 1800 to nearly finish the week flat. Small cap stocks took it more on the chin this week with the S&P 600 down 1.86% and the Russell 2000 down 1.01% for the week.
S&P 500 Member Trend Strength
As shown below, the long-term outlook for the S&P 500 is clearly bullish as 81.2% of the 500 stocks in the index have bullish long-term trends. The market's intermediate-term outlook has weakened a bit, falling from 78.0% two weeks ago to 70.2%. The market’s short-term outlook also remains in bullish territory at a reading of 61.6% this week, though slipping from a 72.8% reading two weeks ago. What is most important is the market’s still very strong long-term outlook, which does not suggest a market top is forming.

* Note: Numbers reflect the percentage of members with rising moving averages: 200-day moving average (or 200d MA) is used for long-term outlook, 50d MA is used for intermediate outlook, and 20d MA is used for short-term outlook.
The most important section of the table below is the 200d SMA column, which sheds light on the market’s long-term health. As seen in the far right columns, you have 81% of stocks in the S&P 500 with rising 200d SMAs and 80.0% of stocks above their 200d SMA. Also, nine out of ten sectors are in long-term bullish territory with more than 60% of their members having rising 200d SMAs with the utility sector the weakest of the bunch with only 38.7% of its members with rising long-term moving averages.

Source: Bloomberg
S&P 500 Market Momentum
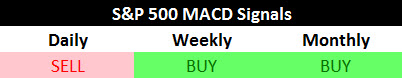
The Moving Average Convergence/Divergence (MACD) technical indicator is used to gauge the S&P 500’s momentum on a daily, weekly, and monthly basis. The daily MACD for the S&P 500 went on a sell signal last week as the market has been digesting its recent gains while the intermediate (weekly) and long-term (monthly) outlooks remain on buy signals.
Source: Bloomberg
Digging into the details for the 500 stocks within the S&P 500 we can see that the daily momentum for the market has slipped to 27.0%, down from a reading of 77% a month ago and is now deep into bearish territory. Readings below 20% have often marked intermediate lows so if we do get below that threshold we need to be on the alert for a rush of buyers coming in to signal an important low.
The intermediate momentum of the market continues to slide from a reading of 67% two weeks ago to this week’s 62% reading, still remaining in bullish territory.
The market’s long-term momentum remains solid at a strong 78% this week, putting it well into bullish territory.

Source: Bloomberg
While it is encouraging to see the market’s long-term momentum remains in bullish territory, it has been a concern that the market’s daily momentum continues to weaken and is now pulling down the market’s weekly momentum which has clearly peaked. While the daily MACD readings are approaching oversold territory the weekly readings remain elevated and so further market declines are still possible.

Source: Bloomberg
52-Week Highs and Lows Data
The insightful Lowry Research Corporation conducted a study on market tops recently (click for link) in which they looked at all major market tops since the Great Depression and found selectivity is a hallmark of all market tops, in which participation in the bull market fades as individual stocks enter their own private bear markets well before the market peaks. They found that, on average, 17.26% of stocks were at or within 2% of their 52-week highs on the day the market peaked while 22.26% were off by 20% or more from their highs, indicating more stocks were experiencing bear markets than were participating in rallying to new highs. For this reason, a look at 52-week breadth of the markets is helpful in detecting an approaching bull market top.
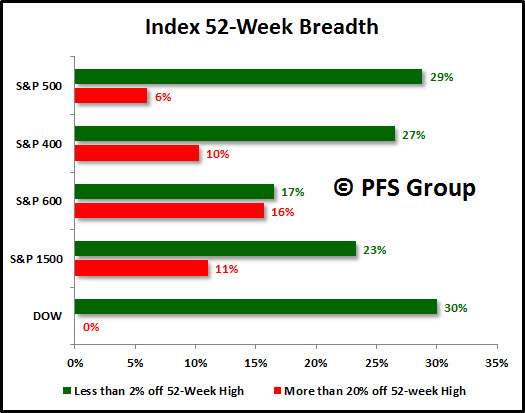
As shown below, currently 23% of the S&P 1500 stocks (includes S&P 500, S&P 400, and S&P 600) closed within 2% of their 52-week highs while 11% where in bear markets. This two-to-one ratio is far better than the 17.3% to 22.3% that Lowry’s found near market tops and better than the near split tape at the 2007 market top as shown below.

Digging deeper into the data confirms that the market continues to display impressive internals and does not suggest a danger of rolling over into a bear market. For example, the S&P 500 (large caps) shows the strongest margin between those near new highs (29%) and those in bear markets (6%) with the S&P 600 (small caps) showing the weakest margin between those near new highs (17%) and those in bear markets (16%), but the overall S&P 1500 remains healthy with 23% near their highs and 11% in bear markets.
Source: Bloomberg
The current market leaders are consumer staples, materials, health care, and financials as these sectors have the highest percentage of members within their group that are within 2% of a new 52-week high and very few members who are currently experiencing a bear market (20% + decline). The fact that the top group is the consumer staples sector suggests the market is taking on a more defensive tone and coupled with the weakening daily and weekly MACD readings, there still lies the risk of a market pullback.

Source: Bloomberg
Summary
The market’s long-term trend and momentum remain firmly in bullish territory and 52-week breadth data on the S&P 1500 shows no signs of a major market top. That said, sentiment levels are elevated and intermediate and short-term momentum are slowing. With 52-week breadth being led by the consumer staples sector, investors are reflecting a decreased appetite for risk. These developments indicate a higher probability of a market pullback or consolidation from elevated levels, however, a correction is likely to be a buying opportunity given the market’s long-term internal momentum remains strong.


