


The markets were essentially flat this week with the S&P 500 up only 0.11%. Small caps took a breather with the S&P 600 down 1.13%. Earnings season continues with 75% of companies beating earnings and showing an average positive surprise of 4.19%. The markets continue to work off an overbought condition and given short-term indicators are not oversold the recent weakness is likely to carry into next week.
S&P 500 Member Trend Strength
As shown below, the long-term outlook for the S&P 500 is clearly bullish as 86.6% of the 500 stocks in the index have bullish long-term trends, up from a reading of 85% a month ago. The market's intermediate-term outlook has also improved, jumping from 50.4% a month ago to 81.0%, pushing it deep into bullish territory. The market’s short-term outlook also strengthened to this week’s reading of 80.2% as it too moved deep into bullish territory. What is most important is the market’s strong long-term outlook, which still does not suggest a market top is forming.

* Note: Numbers reflect the percentage of members with rising moving averages: 200-day moving average (or 200d MA) is used for long-term outlook, 50d MA is used for intermediate outlook, and 20d MA is used for short-term outlook.
The most important section of the table below is the 200d SMA column, which sheds light on the market’s long-term health. As seen in the far right columns, you have 87% of stocks in the S&P 500 with rising 200d SMAs and 83.6% of stocks above their 200d SMA. Also, all ten sectors are in long-term bullish territory with more than 60% of their members having rising 200d SMAs.

Source: Bloomberg
S&P 500 Market Momentum
The Moving Average Convergence/Divergence (MACD) technical indicator is used to gauge the S&P 500’s momentum on a daily, weekly, and monthly basis. The daily MACD for the S&P 500 has been on a buy signal since the middle of October but is on the verge of moving to a sell signal should prices moderate much further.

Source: Bloomberg
Digging into the details for the 500 stocks within the S&P 500 we can see that the daily momentum for the market has slipped to 59.0%, down from last week’s 77% reading and pushing it into neutral-bearish territory.
The intermediate momentum of the market improved from last week’s 61% reading to this week's 63% reading, with the market’s intermediate momentum barely in bullish territory.
The market’s long-term momentum remains solid at a strong 77% this week, putting it well into bullish territory.

Source: Bloomberg
While it is encouraging to see the market’s long-term momentum remains in bullish territory, the market’s weekly momentum had been diverging with the S&P 500’s advance with a series of lower highs. The weekly numbers have finally broken the string of lower highs on rallies as the current reading breached the highs seen in August.

Source: Bloomberg
52-Week Highs and Lows Data
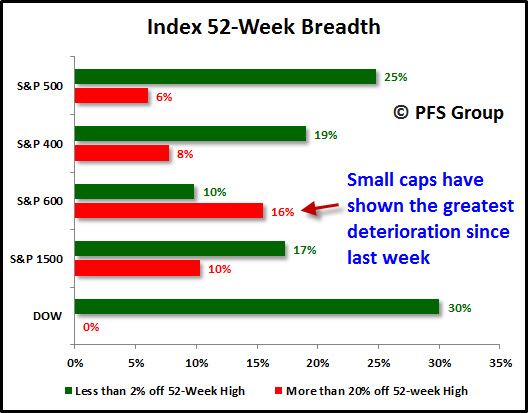
The insightful Lowry Research Corporation conducted a study on market tops recently (click for link) in which they looked at all major market tops since the Great Depression and found selectivity is a hallmark of all market tops. Simply put, participation in the bull market fades as individual stocks enter their own private bear markets well before the market peaks. On average, 17.26% of stocks were at or within 2% of their 52-week highs on the day the market peaked while 22.26% were off by 20% or more from their highs, indicating more stocks were experiencing bear markets than were participating in rallying to new highs. For this reason, a look at 52-week breadth of the markets is helpful in detecting an approaching bull market top.
The market continues to display impressive internals and does not suggest a danger of rolling over into a bear market. For example, there are 17% of stocks within the S&P 1500 that are within 2% of their 52-week highs while only 10% are experiencing bear markets, a comfortable margin relative to the average found by Lowry Research. The S&P 500 (large caps) shows the strongest margin between those near new highs (25%) and those in bear markets (6%) with the S&P 600 (small caps) showing the weakest margin between those near new highs (16%) and those in bear markets (10%), as those in bear markets outnumber those near new highs.
Source: Bloomberg
The current market leaders are industrials, health care, consumer discretionary, and consumer staples as these sectors have the highest percentage of members within their group that are within 2% of a new 52-week high and very few members who are currently experiencing a bear market (20% + decline), if any new 52-week lows. This is bullish as two of the top three sectors are cyclical stocks that tend to peak ahead of the market, and the fact that these are the strongest sectors is encouraging.

Source: Bloomberg
Looking at the S&P 1500 which has small, medium, and large cap stocks within it shows strong breadth as the spikes in new highs during market rallies trumps the spikes in new lows during market pullbacks. This illustrates that the bulls remain in firm control of the markets with no signs of a major top.

Market Indicator Summary
Below is a multi-indicator chart of the S&P 500 that measures breadth and momentum. The second, third, and fourth panels show the market had reached overbought territory and why we were calling for a short-term top last week. Given levels are only at neutral levels we likely have further to drop heading into next week before another short-term low materializes.

Source: Bloomberg
Summary
The market’s trend and momentum remain firmly in bullish territory and the strength of breadth levels indicate a market nowhere close to forming a bull market top. That said, the market remains overbought and we are seeing weakness out of small caps and rotation out of some cyclicals into defensive sectors, which suggests we may have more weakness ahead of us before the market finds its footing.


