


Summary
- The biggest sectors of the market were laggards in the first part of the year, but are now displaying the greatest strength
- Credit markets and junk bonds are confirming the market’s move higher
- Recent improvement in credit markets suggests domestic LEIs continue to rise into the fall
- With recent market improvement, likely nearing a short-term top or consolidation
Back in April there were several market pundits making the claim that the large cap S&P 500 and Dow indices would soon play catch up with the beaten up small cap Russell 2000 index and the technology-heavy NASDAQ composite. However, a closer look under the market’s hood suggested a consolidation rather than a top, as argued a couple months ago (click for link). As a quick recap: What pushed me into the consolidation camp was a look at 52-week high/low data, coupled with a large surge in momentum and capitulation-like selling in the NASDAQ. That, coupled with improving economic momentum suggested the markets would regain their footing as we have now seen with new highs in major indices and sectors.
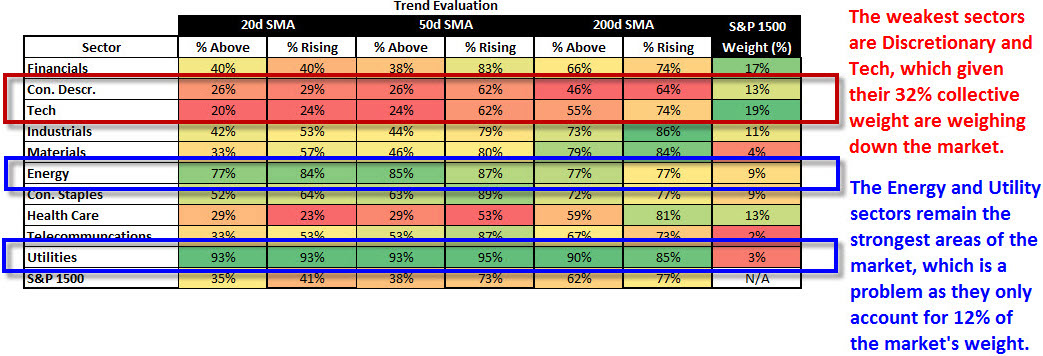
A major drag on the indexes since the beginning of the year had been a notable underperformance by the largest sectors of the market. For example, in April I took a snapshot of the S&P 1500 (which represents ~ 90% of the entire US market capitalization) and you can see when looking at the table below at the time that the consumer discretionary and technology sectors had the worst breadth (fewest members above moving averages) with the health care and financial sectors not too far behind. The consumer discretionary, technology, and health care sectors make up 45% of the S&P 1500 and throw in the weak financial sector with a 17% weight and you are talking 62% of the market that had horrible breadth.
Trend Summary as of 04/25/2014
Source: Bloomberg
A look at the current snapshot of trend strength within the S&P 1500 paints a completely different picture as the biggest sectors now show the strongest short (20 day) and intermediate-term (50 day) breadth while the smallest sectors like the utility and telecommunication sectors are showing the weakest breadth. Luckily those two sectors combined only make up 5% of the market.

Source: Bloomberg
The improvement seen in the market’s biggest sectors have helped to push markets higher as their momentum continues to build. The Moving Average Convergence/Divergence (MACD) technical indicator is used to gauge the S&P 1500’s momentum on a daily, weekly, and monthly basis. The weekly MACD for the S&P 1500 went on a buy signal last week so that not only its intermediate (weekly) outlook is bullish, but so too are its short-term (daily) and long-term (monthly) outlooks as all-time periods are on momentum buy signals.
Breaking out the S&P 1500 by its sectors and time frames shows that largest sectors possess the strongest short-term (daily) momentum with the greatest percentage of their members on MACD buy signals. These same sectors still show the weakest intermediate-term (weekly) momentum, but hopefully their short-term improvements can spill over into longer term improvements.

Source: Bloomberg
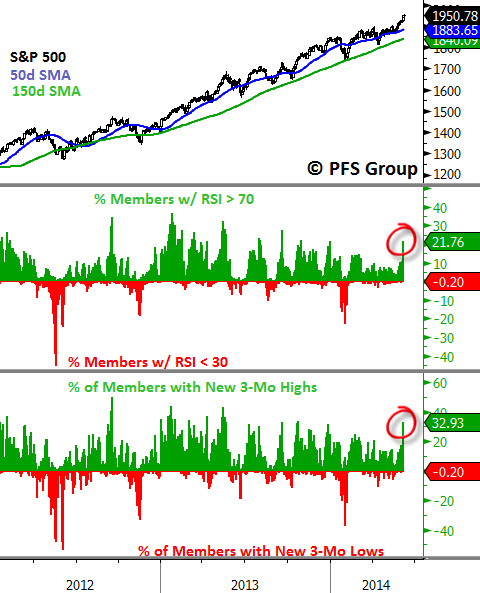
Market momentum is clearly improving as the percent of members in the S&P 500 Index hitting 3-month new highs surges to nearly 33% (third panel below), and further signs of strength come from looking at S&P 500 members with a Relative Strength Index (RSI) reading north of 70, which currently stands at roughly 20%, the highest levels thus far in 2014.
Source: Bloomberg
The improvement in the market’s more cyclical sectors like consumer discretionary and technology bode well for the economy as typically these sectors lead the market when the economy is picking up steam and weaken when the economy softens. This can be seen when looking at the Citigroup Economic Surprise Index (red line below) versus the consumer discretionary ETF (XLY) relative strength to the consumer staples ETF (XLP). Peaks in positive economic surprises tend to coincide with the consumer discretionary sector underperforming the consumer staples sector and the opposite occur at troughs in economic surprises. It’s therefore good news to see economic data support the improvement in the consumer discretionary sector's relative performance to the consumer staple sector.

Source: Bloomberg
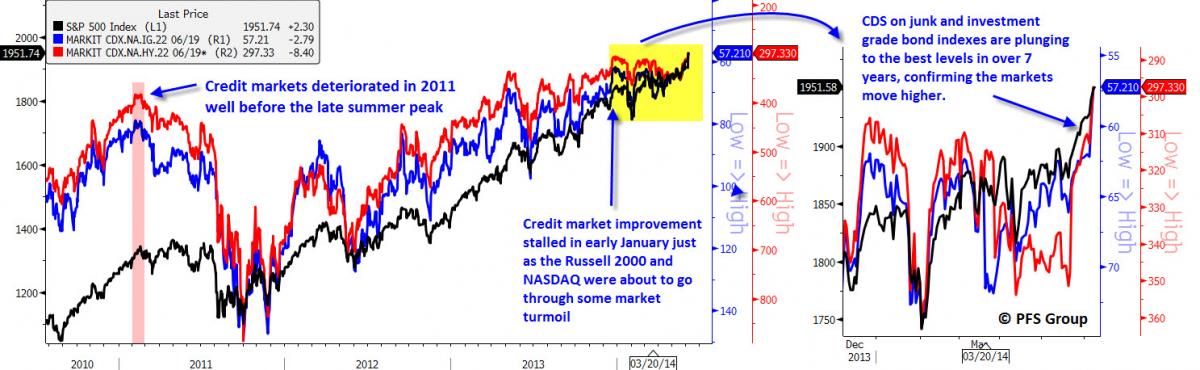
A further sign that confirms the market’s strength is improvement in the junk bond market. I look at credit default swap (CDS) indexes for both junk bonds (high yield) and investment grade bonds to see how the credit markets agree or disagree with the stock market as the credit markets often peak and trough prior to the stock market. A perfect example was in 2011 when the credit markets began to weaken well before the market plunged in August of 2011 when US debt was downgraded by Standard & Poor’s.
Credit default swaps (shown inverted below for directional similarity) on both junk bonds (red line) and investment grade bond indexes (blue line) began to rise and signaled stress was building in the credit markets that wasn’t readily visible in the stock market. The credit market deterioration correctly warned of a stock market and economic peak and provided an early warning. Likewise, the same occurred when the credit market improvement stalled at the start of the year just before the growth areas of the market like the Russell 2000 and NASDAQ were peaking. It’s great news then that both CDS indexes below are confirming the markets move to all-time highs as these CDS indexes hit their best level in 7 years.
Source: Bloomberg
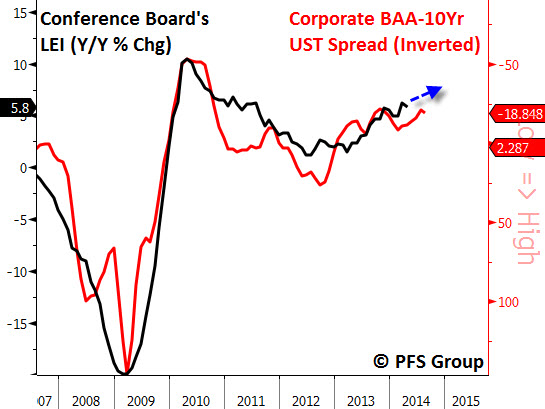
The improvement in the credit markets bodes well for the economy as credit markets serve as a great leading economic indicator (LEI) and are actually an LEI of LEIs. For example, the spread between investment grade bond yields and the 10-yr UST (red line below) leads the year-over-year (YOY) rate of change in the Conference Board’s Leading Economic Index (black line below). The close link between the two is shown in the image below going back to the early 1970s.

Source: Bloomberg
Zooming in shows that the improvement in credit spreads suggests the Conference Board’s LEI continues to improve well into the fall.
Source: Bloomberg
The markets and economy appear to be in sync once again as both are picking up momentum and hitting new highs for this cycle. One area of note clearly gaining some momentum is the employment picture, which continues to pick up steam. So far in 2014 we are averaging monthly payroll gains of 214K, which is building on the 194K average of 2013, the 186K average in 2012, and the 174K average in 2011. In fact, should the US economy continue to average monthly payroll gains of 214K that would place 2014 as the strongest yearly average of payroll gains in well over a decade.
That said, the markets are getting a little overheated and several of my intermediate-timing gauges are reaching frothy territory (see 2nd and 3rd panel below). Readings at these elevated levels suggest either a consolidation of the recent gains or a small pullback. Given the move to new highs in the advance-decline line for the Russell 3000 Index (~ 98% of the entire US market cap) and a surge in 1-month new highs, any weakness in the coming week should be contained and orderly.

Source: Bloomberg
Summary
The biggest sector weights of the major indices like consumer discretionary, technology, and financials were holding the markets back as they lagged more defensive sectors like utilities and consumer staples. However, these sectors are showing signs of life as their momentum is picking up steam and helping to push the markets higher. The new signs of life coming from the riskier sectors are being confirmed by the junk bond market, which is validating the market’s move to new highs. The improvement seen in the credit markets also suggests the economy continues to gather steam, which is readily visible when looking at the employment data. While market momentum is building we are currently overbought and should see the markets digest their gains by either consolidating or coming off their highs. Given the confirmation of the market's move to new highs by advance-decline lines with the support of strong momentum, any near-term decline should be orderly and contained as the bulls regroup before charging higher.


