


“Only when the tide goes out do you discover who’s been swimming naked.” — Warren Buffett
Summary
- The Fed liquidity spigot closes in October
- Commercial bank credit growth is picking up the Fed’s slack
- Margin credit and the Yen-carry trade may serve as other monetary spigots
- As long as various monetary spigots remain open, bull market continues on
As any good market technician will tell you, rotations are the lifeblood of any bull market. The time to worry is when money stops flowing from sector to sector and decides, instead, to shift en masse to a separate asset class like bonds or cash. This was the case in the last bull market where the final sectors that saw inflows of capital were the basic materials and energy sectors, which didn’t peak until the middle of 2008. When they started to decline the last support for the bull market had eroded and equity markets went into a tailspin.
Similarly, liquidity plays a major role in investments where strong liquidity lifts asset prices while a withdrawal of liquidity exposes the players who are overleveraged and undercapitalized—that is, "swimming naked" as Warren Buffett put it. One of the ways liquidity impacts asset prices is by how it relates to "animal spirits" and investor sentiment. As rotation within the various equity sectors is the lifeblood of a bull market so too is the rotation between the various market spigots of liquidity to keep assets afloat. As long as one spigot opens while another closes, and the general level of liquidity remains stable or continues to grow, risk assets like equities generally peform well.
When the spigots close, however, it is time to run for the hills as was the case in 2007 with markets peaking and economic data signaling recession. I chronicled this development as the market started to peak then in an article, “Credit Erosion: The Worst Is Yet to Come,” with the freezing of the mortgaged-backed securities market, subsequent moves by the Fed, followed by a peak in the commercial paper market. Remember when GE couldn’t even pay its employees or purchase supplies when the commercial paper market froze in October 2008 (article)? Jeffrey Immelt, CEO of General Electric personally called then Treasury Secretary Hank Paulson about the crisis to explain how serious it was getting.
For this reason it is important to keep a watchful eye on all of the various liquidity spigots and as long as there are enough flowing into the system, risk assets will likely stay afloat in the sea of liquidity. Returning to the rotation theme, you can have one spigot close as long as another opens, it’s when the music stops that dark clouds begin to form.
The Commercial Bank Liquidity Spigot
A case in point is analyzing the relative growth in commercial bank credit compared to the Federal Reserve. Since 2010 U.S. commercial bank credit and Federal Reserve credit have acted like a yin-and-yang where when one accelerates the other decelerates. I do not think it is coincidence that the Fed typically ends its various rounds of QE when commercial bank credit begins to expand. When the Fed sees the private sector step up, it typically steps down and that was exactly the case with the Fed’s “taper” that began late last year.
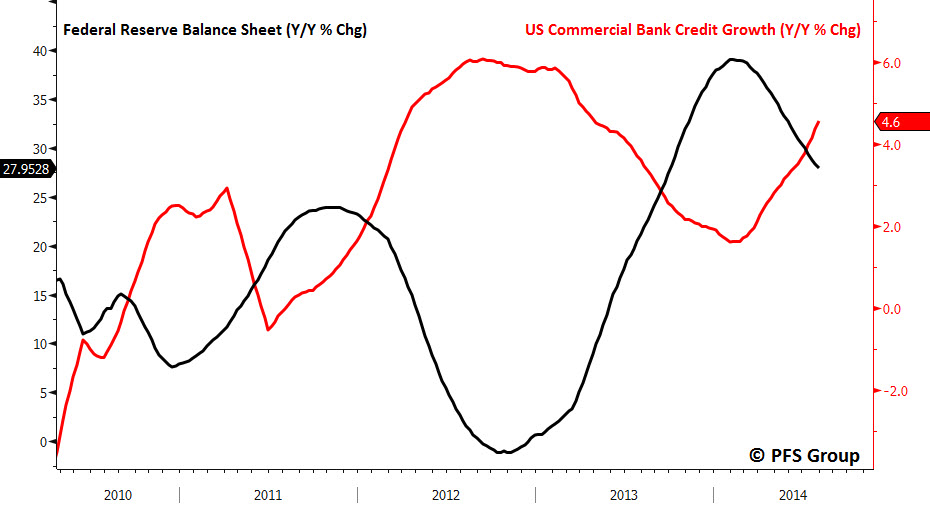
Source: Bloomberg
What is important to analyze and why the bull market remained alive even after the various rounds of QE ended was that total liquidity (Fed + Commercial Bank Credit) remained positive. There were periods where the growth in total credit decelerated while remaining positive, which typically correlated with weaker equity returns, though total credit growth never dipped into negative territory and the current bull market continued on.
This is born out in the figure below which highlights “thin air credit” and the S&P 500. Note the period in 2011 in which the correlation between the two broke down (shown in yellow), which I think was more due to heightened investor anxiety regarding the U.S. debt downgrade than from easing in liquidity growth. While not shown, U.S. jobless claims that are highly correlated with the S&P 500 tracked total thin air credit growth quite closely in 2011 and so it appears that U.S. stocks were off relative to total credit growth and not the other way around.

Source: Bloomberg
As shown in the very first chart, the Fed is slowing down its pace of credit growth while U.S. commercial bank credit continues to accelerate, which is causing total thin air credit growth to remain at elevated levels. If we continue to see commercial bank credit growth expand ahead while the Fed continues to wind down its pace of asset purchases, then the ending of another round of Fed QE may not be as disastrous as many bears contend, particularly if other liquidity spigots begin to open. One such spigot that is highly correlated to the stock market is margin debt.
The Margin Credit Liquidity Spigot
Whenever we see the rate of growth in margin credit accelerate we typically see strong equity returns and vice versa. As shown below, it appears the 6-month rate of change in NYSE margin is bottoming and the margin liquidity spigot may be flowing once more ahead.

Source: Bloomberg
If margin credit growth does begin to expand in the months ahead there may be some relief for small cap stocks which have taken an absolute beating since margin credit growth peaked in February. As margin credit is associated with animal spirits, should margin credit pick up we are likely to see small cap stocks (Russell 2000) gain some of the ground they lost to large cap stocks (S&P 500) over the last few months.

Source: Bloomberg
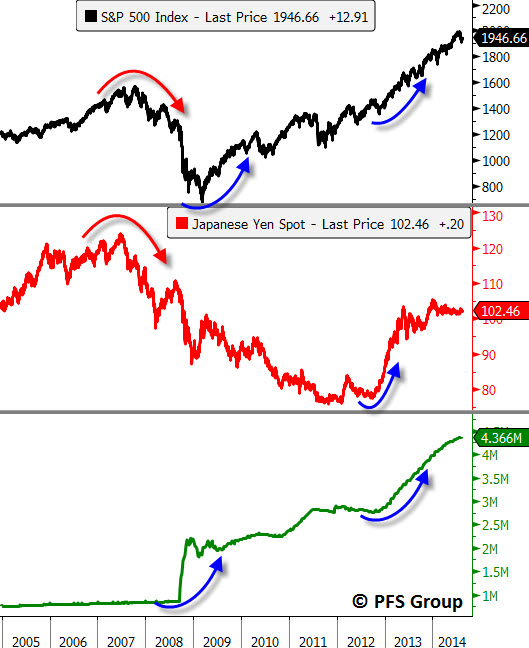
The Yen-Carry Trade Spigot
Just as the mortgage-backed securities and commercial paper spigots were closing in 2007, so too was the Yen-carry trade spigot as the Yen stopped falling against the U.S. dollar. The Yen spigot remained closed throughout the 2007-2009 bear market and it wasn’t until the Fed threw wide its monetary gates that the dam of Fed liquidity exploded in 2009 and the bear market ended. Fast forward to 2012 and we see the makings of a turbocharged stock market run as the Yen was about to be massively devalued and the Fed was getting ready to start up the engines on its printing press. The twin forces of the Yen-carry trade in hyper drive as well as a loose Fed set the stage for the best year in stocks in more than a decade in 2013.
Source: Bloomberg
Since the end of 2013, we’ve seen the Yen stabilize relative to the dollar and since that time we’ve seen animal spirits moderate as the small-cap Russell 2000 has stalled. Like margin credit, should the Yen-carry trade accelerate ahead we would likely see investor sentiment turn bullish and risk assets like small-cap stocks power higher.

Source: Bloomberg
Taking a long-term historical look at the Yen-dollar exchange rate shows why the Yen began to stall when it hit the 100 level. This was a level that marked prior support going back to 1995 and was a likely spot for the Yen devaluation to stall. Should the Yen weaken relative to the dollar and clear the 3 level it may be getting ready to stage another round of currency debasement. Look for evidence of this should the exchange rate rise north of 5.50, the January 2nd 2014 high.

Source: Bloomberg
What might be the catalyst for another round of Yen devaluation? I can think of 2.85 trillion reasons, which equates to the amount of Japanese government debt coming due this year and in 2015. The massive amount of government debt maturing ahead was also the same logic I used to argue for the first round of Yen devaluation in 2012 (click for link). As shown below, we have 30% of all outstanding debt coming due between now and the end of 2015, and looking out to 2016 we have a cumulative 40% of all Japanese debt maturing. Clearly, there will be a large need for liquidity to meet all of those bond redemptions and it’s likely the Bank of Japan will step in to assist helping the government to meet its obligations.

Source: Bloomberg
Putting It All Together
Whenever we have seen the Fed step back on the monetary reins, volatility has picked up and I would expect the same in the months ahead, particularly as the pickup in inflation this year may curb economic growth in the coming months (click for article). That said, a rise in volatility does not necessarily translate into equity market weakness as the late 1990s can attest. This would particularly be the case should other monetary spigots begin to open like commercial bank credit growth, margin credit, or the Yen-carry trade. If these other spigots begin to open, then the bull market in equities should remain alive and well...just a bit more bumpy than we’ve become accustomed to over the last year.
Should we see these liquidity spigots fail to materialize, investors will need to put on their risk-management hats.


