


As the saying goes, "What goes up must come down," is also true for financial markets and investing themes. Not only does sector rotation occur during a business cycle, but there can also be secular sector rotation into one sector. This is where financial capital flows into a sector in increasing amounts over the period of more than one business cycle, in which one sector's weight is above an average share of one's portfolio and in the S&P 500. This occurs as the underlying fundamentals for a sector become more favorable than normal in the course of the business cycle due to shifts in the economy, financial markets, and technology. Secular shifts in a sector's predominance in the S&P 500 can be seen in the figure below that highlights three different sectors that have had their period to shine.
Figure 1
Source: Barra
The fundamental backdrop that saw energy become the predominant sector in the S&P 500 in the 1970's was an inflationary period due to rampant money creation, tight commodity markets, and political events such as the OPEC oil embargo on the U.S. This backdrop set up a favorable environment for commodities in general and energy in particular, with the weighting of the energy sector nearly doubling in the second half of the 1970s in the S&P 500 from roughly 15% to nearly 30%.
Energy was the top performing sector in the S&P 500 with the sector's weighting increasing substantially as investors chased the returns being made in the sector. However, as more energy supply came onto the markets at a time of falling demand due to high oil prices, the bull market in energy came to an end.
Figure 2
Source: Barra
The next major bull market in US stocks was seen in the technology sector in the 1990s. Near the start of that decade, technology represented roughly 6% of the S&P 500 and vaulted to a zenith near 33% by the end of the century. This secular move in technology was predicated on technological advancement and incorporation of computers and technology in general into the overall economy on an unprecedented level, with the sectors weighting in the S&P 500 reflecting this shift. However, overcapacity and excesses in the industry ultimately deflated the bubble in which the technology weighting in the S&P 500 fell in half to roughly 15% seen at the bottom of the last bear market.
Figure 3
Source: Barra
There has also been another secular sector rotation move, though one that has moved at a much slower pace than the parabolic moves seen in energy and technology. The financial service sector has increased from a weight of roughly 5% in 1980 to nearly 22% currently.
Figure 4
Source: Barra
As mentioned above, there are fundamental factors that often lead to secular shifts in sectors, and the predominant factor that has led to an increase in the weighting of the financial service sector is the price of the commodity it sells—credit. Since 1980 there has been a secular bull market in paper assets as interest rates and inflation have fallen. As interest rates reflect the cost of credit, falling interest rates have led to an increase in the demand for credit as it has become cheaper to borrow, which has fueled the growth within the financial sector.
Figure 5
Source: Moody's Economy.com
However, the favorable secular trend in interest rates that has fueled the growth in the financial service sector may now be coming to an end, as the yield on the 30-year Treasury bond has broken through a downtrend that has been in place for decades and appears to have put in an ultimate low back in 2003 to 2005. If this is the case, a secular trend of rising interest rates does not bode well for the financial sector and may be indicating its period to shine has come to an end.
Figure 6
Source: StockCharts.com
Labor Markets Signaling the Tide Has Gone Out
As the secular bull market in technology picked up steam so did employment, which saw total employment nearly double for the sector over the course of the decade. However, the excess capacity created in the sector led to a sharp reduction in employment as businesses pulled back spending on computers and equipment. In just a few years, capacity utilization plummeted to nearly 55% from over a 90% utilization rate seen in 2000, with employment also taking a pretty nasty haircut.
Figure 7
Source: Moody's Economy.com
Figure 8
Source: Moody's Economy.com
As the technology bubble burst, the number of mass layoffs (layoff actions involving at least 50 workers from a single establishment) skyrocketed as the sector saw a sharp reduction in employment. The sharp reduction in technology employment demonstrated that the secular bull market in technology was over.
Similarly, the trend in mass layoffs in the financial service sector may be signaling that its secular bull market may be over like technology layoffs were as the technology bubble burst. Last week's Market Observation touched on the issue that the worst in the credit markets is yet to come and included an article that showed mortgage job losses have surpassed 40,000 this year alone. The number of mass layoffs in the financial service sector has surged this year to unprecedented levels with the number of mass layoffs nearing the peak seen in the telecommunications sector in the last recession.
Figure 9
Source: Moody's Economy.com
Supporting the trend in mass layoffs data in the financial service sector provided by the Bureau of Labor Statistics (BLS) is the Challenger, Gray, and Christmas, Inc. report that showed announced job cuts surge to 79,459 for August, which was 85% higher than July's levels and 22% higher than August 2006. Of those announced job cuts, the financial service sector accounted nearly half of them.
Last month financial service companies announced cuts of 35,752 workers, which brings the year-to-date (YTD) total to 102,758 jobs lost, more than double the 2006 total. With several months still to go to close out the year, the 2007 total may surpass 115,515 jobs lost in the recession year of 2001. With the surge in announced job cuts recently, the financial sector now tops the list of job cutters and has surpassed the automotive industry which has moved to second place followed by consumer products.
Subprime Flu Infecting Other Financial Industries
Not only has the mortgage industry seen better days but so has the banking industry as the financial fallout from the housing recession spreads to other areas of the financial sector. The deterioration in the banking industry is best illustrated in the Federal Deposit Insurance Corporation's (FDIC) Quarterly Banking Profile. The report for the second quarter of this year was released a few weeks ago and the deterioration in bank balance sheets is clearly visible.
There were 824 institutions reporting net losses for the quarter, compared to 600 unprofitable institutions a year earlier. This is the largest YOY increase in unprofitable institutions since the third quarter of 1996. The proportion of FDIC banks that are unprofitable rose to nearly one out of every ten banks (9.6%), which is the highest level for the second quarter since 1991, the year of the last housing-led recession. Excerpts taken from the FDIC report are provided below:
Figure 10
Source: FDIC
Loss Provisions Rise Significantly
Insured institutions added .4 billion in provisions for loan losses to their reserves during the second quarter, the largest quarterly loss provision for the industry since the fourth quarter of 2002. This was .9 billion (75.3 percent) more than they set aside in the second quarter of 2006.
Charge-offs Continue to Rise
Net charge-offs totaled .2 billion in the second quarter, the highest quarterly total since the fourth quarter of 2005, and .1 billion (51.2 percent) more than in the second quarter of 2006. This was the second consecutive quarter that net charge-offs have had a year-over-year increase.
The loan categories with the largest increases in net charge-offs included consumer loans other than credit cards (up 7 million, or 60.9 percent), commercial and industrial (C&I) loans (up 7 million, or 71.4 percent), residential mortgage loans (up 2 million, or 144.3 percent), and credit card loans (up 3 million, or 12.1 percent). All of the major loan categories posted both increased net charge-offs and higher net charge-off rates.
Figure 11
Source: FDIC
Real Estate Leads the Growth in Noncurrent Loans
The amount of loans and leases that were noncurrent (loans 90 days or more past due or in nonaccrual status) grew by .4 billion (10.6 percent) during the quarter. This is the largest quarterly increase in noncurrent loans since the fourth quarter of 1990, and marks the fifth consecutive quarter that the industry's inventory of noncurrent loans has grown. Almost half of the increase (48.1 percent) consisted of residential mortgage loans.
Figure 12
Source: FDIC
Noncurrent mortgages increased by .1 billion (12.6 percent) during the quarter. Real estate construction and development loans accounted for more than a third (34.2 percent) of the increase in noncurrent loans. Noncurrent construction loans increased by .2 billion (39.5 percent) during the quarter. The amount of home equity lines of credit that were noncurrent increased by 7 million (16.6 percent) during the quarter. The industry's noncurrent loan rate, which was at an all-time low of 0.70 percent at the end of the second quarter of 2006, rose from 0.83 percent to 0.90 percent during the second quarter. This is the highest noncurrent rate for the industry in three years.
Pace of Reserve Growth Picks Up
Banks and thrifts grew their loss reserves by .6 billion (3.2 percent) during the quarter, as loss provisions of .4 billion surpassed net charge-offs of .2 billion. The .6-billion rise in loss reserves was the largest quarterly increase since the first quarter of 2002, but it barely kept pace with growth in the industry's loans and leases. The ratio of reserves to total loans increased from 1.08 percent to 1.09 percent during the quarter, but remains near the 32-year low of 1.07 percent reached at the end of 2006. For the fifth quarter in a row, reserves failed to keep pace with the increase in noncurrent loans. As a result, the industry's 'coverage ratio' of reserves to noncurrent loans fell from .30 in reserves for every .00 of noncurrent loans to .21 during the quarter.
As the FDIC report clearly shows the banking industry has seen better days and the resulting deterioration in their balance sheets goes beyond residential real estate. The report suggests that eroding credit quality is spreading beyond home mortgages as all major loan categories posted both increased net charge-offs and higher net charge-off rates. This spreading credit deterioration is seen in Figure 11 above, which shows consumer credit card charge-offs rising 144.3% over 2nd quarter 2006, followed by commercial and industrial charge-offs (71.4%) and consumer credit other than credit cards (60.9%). Not only were the rates for charge-offs significant but also the amounts. Residential mortgage charge-offs took a back seat compared to consumer credit (other than credit cards) and commercial and industrial charge-offs, which rose 7 million and 7 million respectively.
Figure 13
Source: FDIC
The financial environment is only likely to worsen for banks as highlighted last week that the worst in credit erosion is yet to come. What's more, the banking industry has never been leveraged to the residential real estate than it is today with residential properties representing roughly 34% of banks assets. This is particularly troubling when looking at the current supply of existing homes. Commentary from Brian Pretti from ContraryInvestor is provided below.
Figure 14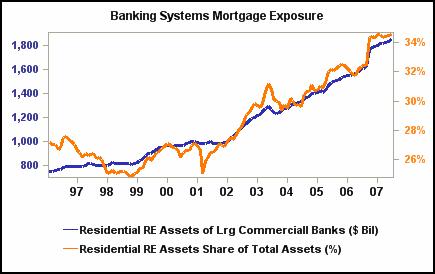
Source: Moody's Economy.com
Wow!...Every once in a while a chart comes along that simply makes us sit back and say "wow". For what it's worth, here's one right below. Wow. As you may have seen in Monday's release of existing home sales inventory number, we're sitting at 9.6 months of supply. Just for a bit of clarity, it's really condos at the moment that are driving the total number, although the inventory of single family homes for sale is nothing to brush off. Condo inventories are near a 12 month supply right now and SFR's rest at 9.2 months of supply. As is more than clear below, current levels are near very important historical peaks. But as we've been saying far too many times as of late, the big ARM reset period lies dead ahead. Without trying to look for the dark cloud in everything, the current circumstances in the housing market seem to be setting up the potential for historical records in what you see below. We'll see how it all goes, but over the next year we would not be surprised in the least to see this number spike to a record. We expect as much.
Figure 15
Source: ContraryInvestor.com
As seen in the labor markets above, the financial industry's secular sector rotation may be coming to an end. The markets may be signaling as much and confirming the labor data as the financial sector has broken through a trendline that has been in place since the start of the current bull market back in 2003. Once more, a dramatic shift in relative performance is clearly visible when looking at the financial sector ETF's performance relative to the S&P 500, which is plotted below the chart and shows a steep decline with very little recovery taking place since the July sell-off. The same goes for the banking industry, which has broken its trendline and has shown poor relative performance to the overall market.
Figure 16
Source: StockCharts.com
Figure 17
Source: StockCharts.com
There is ample evidence in the economy and financial markets to support a Fed rate cut as the economy is clearly slowing and the housing recession is still ongoing. Unless the Fed opens up the monetary spigots, the financial service industry is in for more pain and more layoffs.
The FDIC report highlighted above was for the second quarter, before the seizure in the credit markets. Imagine what the banks' balance sheets are going to look like in the third quarter when they reprice their mortgage-backed securities. Imagine what they will look like down the road without a Fed rate cut. Unless the Fed moves quickly, this may very well be the tipping point in the secular rotation within the financial service sector, leaving the door open for another sector to take its place. That likely candidate is energy.
Today's Market
The markets retraced yesterday's gains after the National Association of Realtors pending existing home sales report for July fell to the lowest level in nearly six years. The news supported the case for a Fed rate cut but increased investor fears that housing may lead the economy into a recession. The Fed seemed to disagree as its Beige Book was released today which said that the financial market turmoil has made the housing recession worse, though the overall economy hasn't been widely damaged and remains robust.
The increased likelihood of a downturn as seen by the housing report and the Fed Beige Book that did not make a rate cut a sure bet led to a market sell-off with triple digit declines seen in the Dow. The Dow Jones Industrial Average fell 143.39 points to close at 13305.47 (-1.07%), the S&P 500 lost 17.13 points to close at 1472.29 (-1.15%), and the NASDAQ gave up 24.29 points to close at 2605.95 (-0.92%).
Treasuries rallied with the yield on the 10-year note falling 8.5 basis points to close at 4.473%. The dollar index was down on the day, falling 0.25 points to close at 80.63. Declining issues represented 70% and 64% for the NYSE and NASDAQ respectively, reflecting a broad sell-off in the markets.


