


 Aside from the Federal Reserve and its policies, there is probably no other more controversial force in the financial markets today than high frequency trading. Since today also happens to be the three year anniversary of the Flash Crash—the very event that thrust HFT into the public spotlight—let’s take a moment and consider this topic from what’s been learned over recent years.
Given the ability of high frequency trading to operate at extremely high speeds with a large amount of orders spread througout the market, we can safely conclude the following three things: 1) HFT can be used to create a high resolution map of the market in real-time, 2) HFT can influence or manipulate the market for gain, and 3) HFT puts the market at systemic risk.
The latter two points have been discussed, documented, and attested to at such a level that there is little need to elaborate on them; however, the first point has not received as much attention and, I feel, offers a much better understanding of the technology and its implications.
High Frequency Radar
We should recognize that a good map is an extremely valuable asset. If one could create a highly accurate map of the market, and thus track or predict where money is flowing at all times, this amounts to no more than a modern day treasure map. Yet, a “map” is only a basic description of what’s being developed. The more important question is, how is this map created and what’s the underlying process?
The answer to this is found in the technological precursor to HFT: Radar.
Although developed largely by the military for detection, tracking, and surveillance, today it is used across the globe for many different purposes. Here, Wikipedia provides a partial list:
The modern uses of radar are highly diverse, including air traffic control, radar astronomy, air-defense systems, antimissile systems; marine radars to locate landmarks and other ships; aircraft anti-collision systems; ocean surveillance systems, outer space surveillance and rendezvous systems; meteorological precipitation monitoring; altimetry and flight control systems; guided missile target locating systems; and ground-penetrating radar for geological observations.
The most relevant part to our discussion, however is this: “High tech radar systems are associated with digital signal processing and are capable of extracting useful information from very high noise levels.”
Without going into too many details, radar, like high frequency trading, is most commonly used by emitting a high frequency signal that is reflected back to a monitoring station and then processed to extract useful information for surveillance over large areas.
Two main ways in which radar operates is by sending out a constant high frequency or by changing the frequency in a predictable manner over time. Since a constant frequency can be easily detected and jammed, in competitive situations it is much better to use variations of the four most basic waveforms: sine, square, triangle, and sawtooth—as seen below.

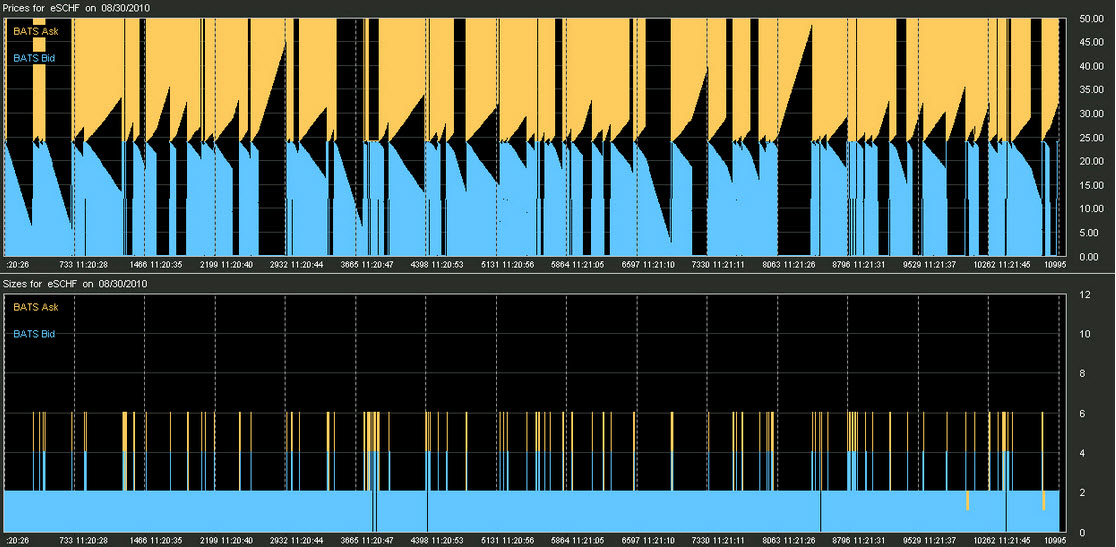
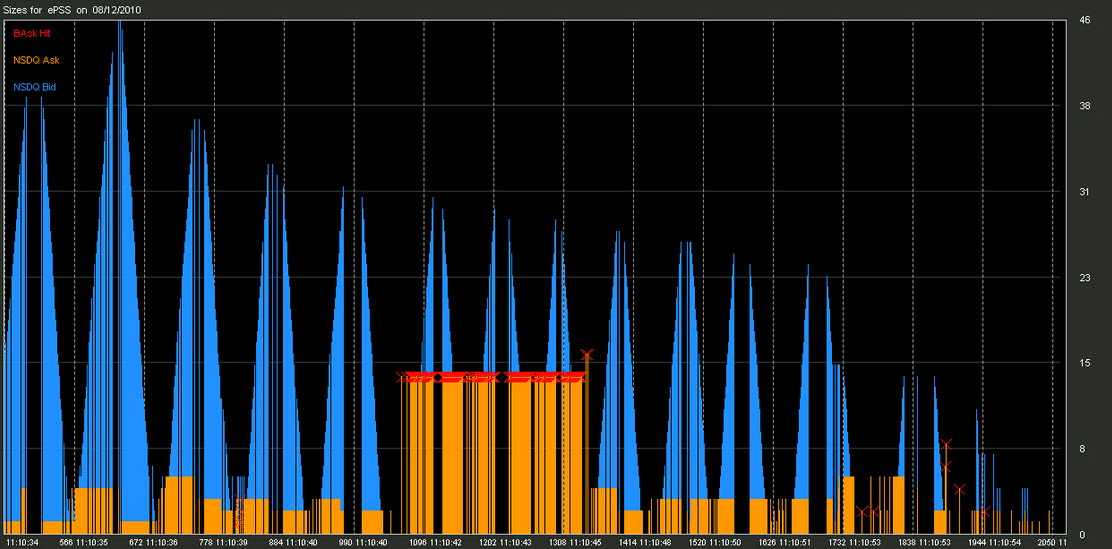
Anyone familiar with the market data site, Nanex, or the popular financial reporting site, Zerohedge, is no doubt familiar with the numerous charts they’ve posted showing the extremely creative ways in which HFT uses frequency modulation of buy and sell orders—that is, quotes—to probe the market.
Here are a number of the most famous signal patterns identified by Nanex several years ago in their cleverly titled post, “Crop Circle of the Day - Quote Stuffing and Strange Sequences”. Keep in mind, these signal patterns represent quotes being transmitted throughout the market at a range, from what I gather, typically between 1 to 15 kHz, or 1000 to 15,000 quotes per second. Therefore, in order to see the underlying structure of the HFT signal, most of these charts are extremely zoomed in at second or microsecond detail. (Click for larger image)


Given that these HFT “radar signals” are used to explore, track, and predict the market’s motion in real-time, a recent study by Adam D. Clark-Joseph using CFTC audit-level trading data appropriately titled this process “Exploratory Trading”.
Summarizing Clark-Joseph’s findings, Nanex states:
Exploratory trading is a form of manipulation designed to test the market's reaction to a trade. Probing for stop orders would be one form of exploratory trading. This paper specifically investigates exploratory trading that attempts to determine whether the bid/ask spread is about to shift up or down a level. The impact on the market would be an increase in intraday volatility. Exploratory trading distorts the market's view of supply and demand and induces trading activity from other participants. Furthermore, as participants learn of the strategy, they will employ counter-measures - which will further muddy an accurate picture of supply and demand for everyone else.
Later, Nanex also explains:
The top HFTs probe the market by sending in small aggressive orders and then gauging market reaction: a practice that allows them to get a private glimpse of the "true" supply and demand at the expense of everyone else. Once the market direction is ascertained, these HFT aggressively remove liquidity, causing an immediate market move.
The problem, of course, is what happens when you have a large number of high frequency trading firms pushing the limits of this technology and employing all sorts of military-style strategies in a vicious competition over profit. Consider, for example, the following Wikipedia entry regarding the names of common HFT strategies:
These algorithms or techniques are commonly given names such as "Stealth" (developed by the Deutsche Bank), "Iceberg", "Dagger", "Guerrilla", "Sniper", "BASOR" (developed by Quod Financial) and "Sniffer”... Gamers or "sharks" sniff out large orders by "pinging" small market orders to buy and sell. When several small orders are filled the sharks may have discovered the presence of a large iceberged order.
“Now it’s an arms race,” said Andrew Lo, director of the Massachusetts Institute of Technology’s Laboratory for Financial Engineering. “Everyone is building more sophisticated algorithms, and the more competition exists, the smaller the profits.”
When we step back and think of what’s taking place, it really is a form of warfare—especially when you consider how much of the technology being utilized comes straight out of the military’s development of radar, jamming, surveillance, and stealth.
Here, for example, Kevin Slavin presents an entertaining account of this from his TED talk, "How Algorithms Shape Our World":
So, where does all this leave us? One of the key themes I return to in my writings is that this technological arms race is also causing the steady displacement of the human player. When a more dominant player enters the battlefield, it is either run away, get killed, or adopt their technology. When that technology is almost completely automated and able to think, react, and implement a strategy thousands of times faster than us, making it less automated or slowing it down seems unlikely. Thus, the technological arms race being conducted in the financial markets, although funded by us, is really a war waged by machines—algorithms to be exact. How far will this go? For that, there is no clear map.


