


Note from dshort: This commentary has been updated for this morning's release of September Industrial Production.
Official recession calls are the responsibility of the NBER Business Cycle Dating Committee, which is understandably vague about the specific indicators on which they base their decisions. This committee statement is about as close as they get to identifying their method.
There is, however, a general belief that there are four big indicators that the committee weighs heavily in their cycle identification process. They are:
- Industrial Production
- Real Personal Income (excluding Transfer Payments)
- Nonfarm Employment
- Real Retail Sales
The Latest Indicator Data
 According to the Federal Reserve, "Industrial production increased 1.0 percent in September and advanced at an annual rate of 3.2 percent in the third quarter of 2014, roughly its average quarterly increase since the end of 2010." The full report is available here.
Today's month-over-month increase of 1.0% beat the Investing.com forecast of 0.4%.
My personal view is that Industrial Production is probably the least useful of the Big Four economic indicators. It's a hodge-podge of underlying index components and subject to major revisions, which undercuts its value as a near-term indicator of economic health. As a long-term indicator, it needs two key adjustments to have any correlation with Industrial Production reality. First, it should be adjusted for inflation using some sort of deflator relevant to production. Second, it should be population-adjusted.
[You May Also Like: Jim Puplava's Big Picture: LEIs Signaling a Soft Patch Ahead]
The chart below is my preferred way to look at Industrial Production over the long haul. I've used the Producer Price Index for All Commodities as the deflator and Census Bureau's mid-month population estimates to adjust for population growth. I've indexed the adjusted series so that 2007=100.

The most recent data point in this adjusted series is an interim high off the post-recession trough (see the inset above). But it remains below the post-recession highs in 2009 and 2010.
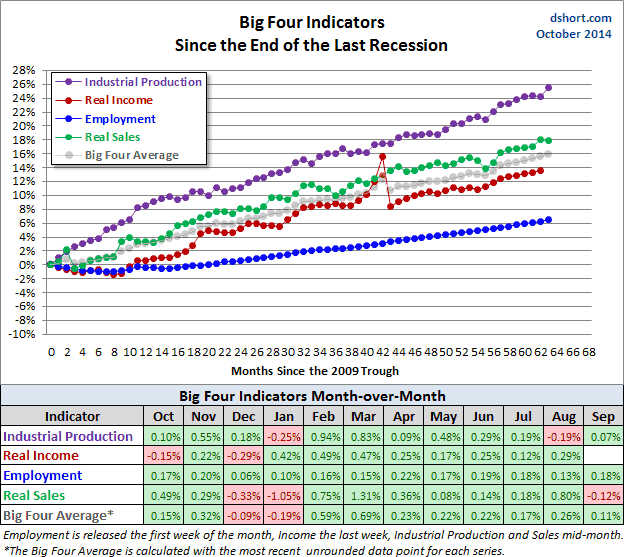
The Generic Big Four
The chart and table below illustrate the performance of the generic Big Four with an overlay of a simple average of the four since the end of the Great Recession. The data points show the cumulative percent change from a zero starting point for June 2009. We now have the three indicator updates for the 61th month following the recession. The Big Four Average is (gray line below).
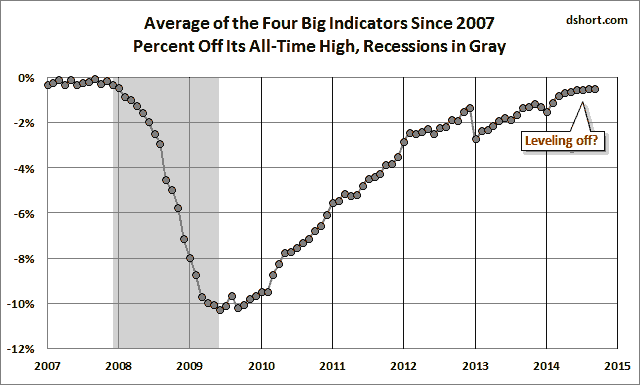
Current Assessment and Outlook
The overall picture of the U.S. economy had been one of slow recovery from the Great Recession with a clearly documented contraction during the winter, as reflected in Q1 GDP. Data for Q2 supported the consensus view that severe winter weather was responsible for the Q1 contraction — that it was not the beginnings of a business cycle decline. However, the average of these indicators in recent months suggests that, despite the Q2 rebound in GDP, the economy remains near stall speed.
The next update of the Big Four be the month-end Real Personal Income less Transfer Payments.


