


The Weekly Leading Index (WLI) growth indicator of the Economic Cycle Research Institute (ECRI) came in at -1.4 in today's public release of the data through March 9th. This is the ninth consecutive week of improvement (less negative) data for the Growth Index and the highest level (i.e., least negative) since August 5th of last year. The underlying WLI also improved, increasing from an adjusted 124.6 to 125.1 (see the fourth chart below).
The big news this week is the ECRI public commentary posted yesterday (March 15th) with the title Why Our Recession Call Stands.
For those of us who like to dig into the details, the most interesting revelation in the commentary involved a shift to the year-over-year WLI change from ECRI's favored, and rather arcane, method of calculating the WLI growth series from the underlying WLI (see note below).
Most data, both public and private, are seasonally adjusted. But the nature of the Great Recession seems to have had an unexpected impact on the statistical seasonal adjustment algorithms that are hard-wired to detect when the seasonal patterns evolve and change over the years. This is normally a good thing, but when the economy fell off a cliff in Q4/2008 and Q1/2009, it was partly interpreted by these procedures as a lasting change in seasonal patterns. So, according to these programs, data from Q4 and Q1 would be expected thereafter to be relatively weak, and therefore automatically adjusted upwards. Our due diligence on this subject indicates a widespread problem, resulting in many recent economic headlines being skewed to the upside. However, we have no way to objectively measure the extent of these problems – either the upward bias for Q4 and Q1 or the downward bias for Q2 and Q3. Fortunately, year-over-year growth rates are naturally less susceptible to these seasonal issues because they involve comparisons to the same period a year earlier that is likely to be skewed the same way. In contrast, smoothed annualized growth rates, which we have traditionally preferred, presume proper seasonal adjustment. While the extent of the seasonal problem will be debated, monitoring year-over-year growth rates is a matter of simple prudence at this juncture not only for ECRI’s indexes but also for other economic data.
The March 15th commentary includes a pair of charts: the WLI YoY and their US Coincident Index YoY. Here is my on version of the former. I've added dots to show the YoY value at the first months of recessions and a dotted line showing the current level.
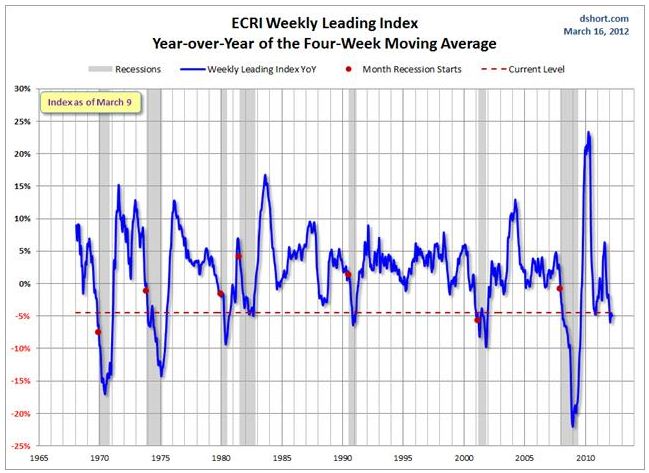
As the chart above makes clear, the WLI YoY is currently at a lower level than at the month for five of the seven recessions during the published series. Of course, the same can be said for its interim YoY trough in 2010. In any case, the behavior of this indicator over the next quarter or so will be especially interesting to watch.


