


The second quarter estimate for US GDP released Friday came in at 1.2%, about half of what most economists expected.
So far this year, the economy is growing at about a 1% annual rate, the worst first-half performance since 2011. GDP growth was revised down to a 0.8% pace in the first quarter from 1.1%. Growth also was revised down for the fourth quarter of 2015 to 0.9% from 1.4%.“The growth trend of the American economy seems on a path of dropping off significantly from its assumed 2% growth trend,” said Conference Board economist Brian Schaitkin. (source)
Consumer spending is really what's holding up the US economy at this point with private investment, net exports, and government outlays all coming in flat to negative.
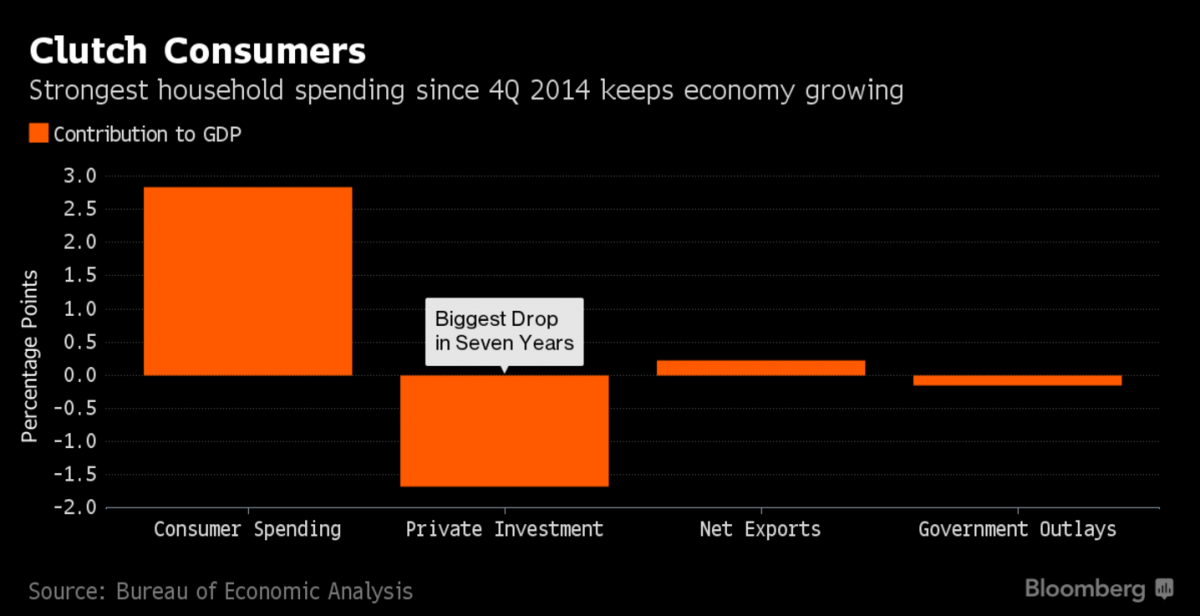
Though we may see a pick-up in the other areas, two major pillars of consumer spending—wages and salaries—came in at the weakest level in three years. This begs the question: how much longer can consumers carry the US economy, especially if business investment continues to decline?
“The more immediate concern of persistently weak business investment spending is that it could at some point translate into diminished hiring if not outright layoffs, which in turn would take the rug out from under U.S. consumers,” Richard Moody, chief economist at Regions Financial Corp. in Birmingham, Alabama, said in a research note. (source)
One of the most reliable early-warning indicators we can monitor to see if layoffs are increasing and recessionary risks in the US are rising is jobless claims. Since this data is collected and updated each week, economists tend to look at the four-week moving average to get an idea of the overall trend. As you can see, jobless claims have yet to raise a red flag, however, their rate of decrease has certainly slowed. Keep this on your radar.

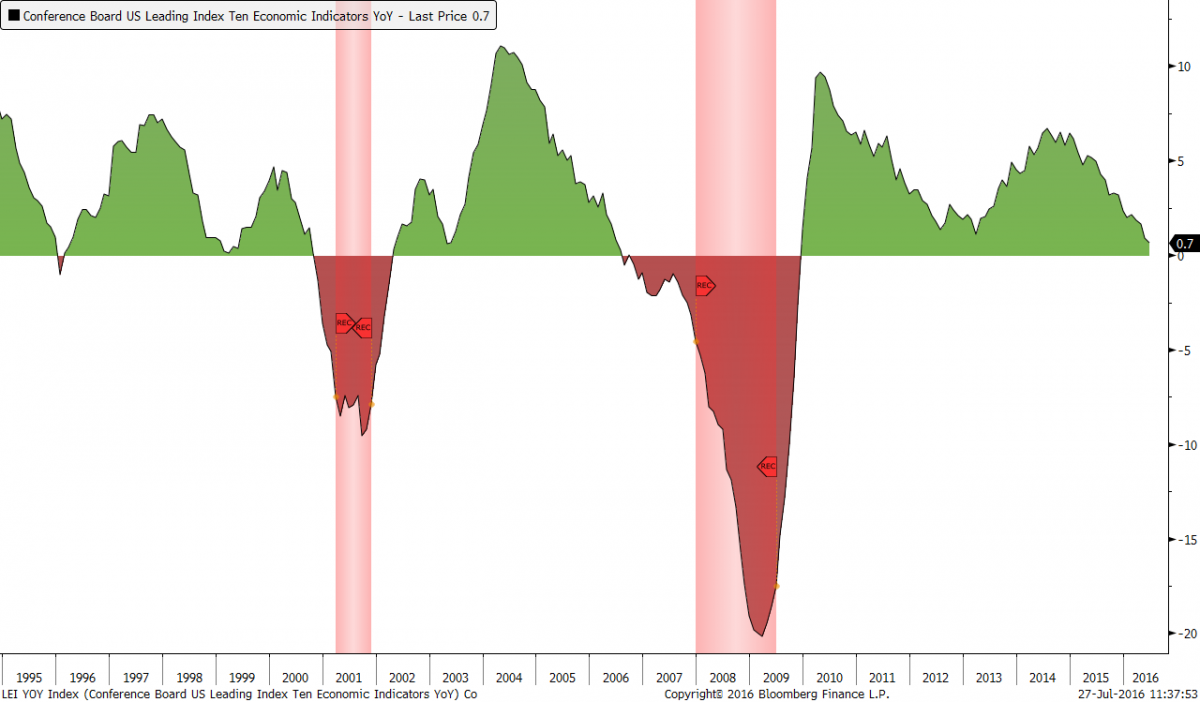
As Brian Schaitkin at the Conference Board noted earlier, it does appear that the "growth trend of the American economy seems on a path of dropping off significantly from its assumed 2% growth trend." We can see this by looking at the year-over-year change in the Conference Board's US Leading Index, which has fallen steeply from its 2014 highs and is now sitting at 0.7%, the lowest rate we've seen post-recovery.
One indicator in particular that we watch very closely is the Philadelphia Fed State Coincident Index, which looks at broad-based economic data from each of the 50 states in the US. The most recent data shows a steep plunge similar to what we saw in 2000 and 2007.

We'll have to see if this recent plunge in the Philly Fed index is a fluke or a shot across the bow that things are turning south. If other economic indicators, like jobless claims and the Conference Board's Leading Economic Index, also start to deteriorate, that'll be a good sign we're heading into trouble.
If you'd like to receive regular updates on this information and more, subscribe to our premium podcast by clicking here.


