


In my article of 15th December 2009 Currencies - Long term forecast, I analyzed the decline of the USD which started in the middle of the 1980's and continued until the end of 2009. The 30 year structure revealed a triangle which I labeled as a large wave "B" possibly to be completed in a couple of years.
In my article earlier this year The USD Century Structure I analyzed how the large "B" wave that spans over 3 decades fits into the larger century structure.
The following is an update of the above mentioned analysis and the USD price structure.
Sentiment
The sentiment is now resembling an echo of the autumn 2009 sentiment. A currency war is currently discussed in the press.
The sentiment indicators which we follow are all approaching extreme negative USD readings and very bullish Euro readings similar to the readings of autumn last year. What is going on and what does it mean ? As the public media again are dooming and trashing the USD, I thought it was time for an update to indicate where we are at present in the Elliott Wave structure.
Commitment of traders
The latest available data shows that hedge funds and other large speculators are more bearish on the dollar than at any time in history. Their total combined position against the USD are at the biggest “net short” level ever recorded. The Hedge Funds and Large Speculators could of course become even more extreme stretching their bet against the USD further, but this scenario is in the latter stages of the game as the pessimism becomes too extreme to sustain.
The Small Traders are now net short of the USD and in the process of increasing their short positions joining the party of Hedge Funds and Large Speculators.
However, the Commercial Hedgers are net long and in the process of increasing their long positions.
This is resulting in an interesting configuration with the Small Traders, Hedge Funds and Large Speculators taking the opposite side of the trade to the Commercial Traders.
A historical view of USD
Multi year monthly chart of USD spanning decades.
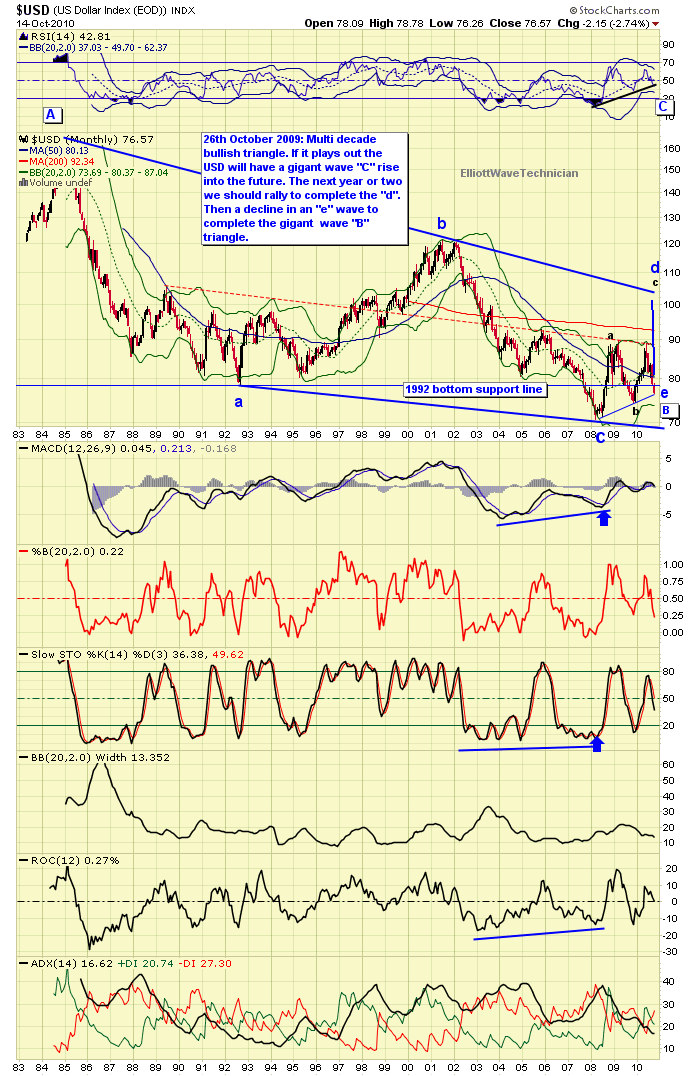
See the blue line that illustrates the potential future path of the USD.
I have identified a large multi decade long triangle in USD which I think is a large wave "B". As you can see a wave "d" (in blue colour) of the triangle is currently in progress. I have labeled the internal structure of the "d" with "a,b" and "c" in black colour. The first "a" and "b" has been completed and the USD is in the beginning of the last wave "c" which will complete the larger "d" of the triangle.
The triangle began in the early 1980's and looks like it will be completed in a couple of years.
When the "B" wave triangle is completed the next trend should be a gigantic rise in a wave "C" spanning multi years and possibly more than a decade.
A closer look inside the triangle

The USD has completed wave “1” of “C” and is in a wave “2” correction, both marked in grey.
The USD is testing the long term 1992 bottom support line. A “throw over” of this support line is in progress, to scare the last dollar bulls out of the game, as well as making the dollar bears fully committed on the short side. According to the latest data this is actually happening.
The first long term target of the USD rally is approx. 104 on the index which is the upper boundary of the triangle.
Point & Figure analysis
We also use a common price structure analysis, the point & figure method, to see if it confirms our Elliott Wave analysis:
Point and figure analysis only uses the price action of the USD. Two letters of the alphabet are used in this method of charting, where “X” represents demand and “O” represents supply.
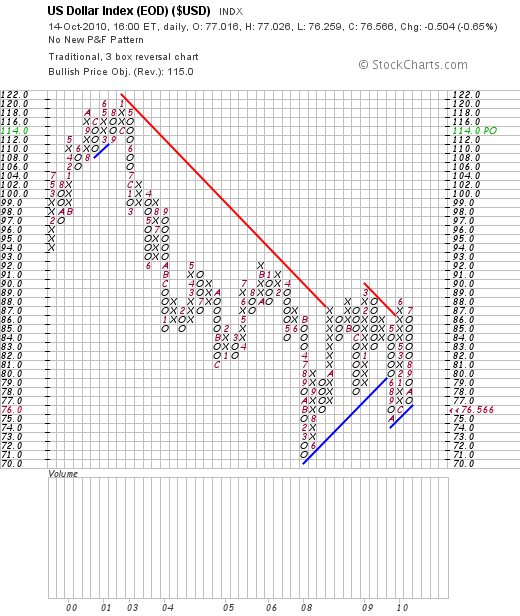
Point & figure has given a buy signal and the bullish price objective is 115 on the USD Index. There is support at 76-77 from a rising trend line on the Index.
Sentiment and commitment of traders interpretation
Investor bullish sentiment rises in bull markets, usually reaching an extreme of bullishness near tops and the opposite near bottoms.
When investors are at a pessimistic extreme, it usually means that they have already completed the selling. The rush from pessimism back to optimism usually triggers buying activity, which helps to push up prices.
The commercials are more often on the right side of the trade at major turns compared to small traders and large speculators.
Alternative
The rise of the USD which started in the late 1970's that we have labelled an "A" wave and that ended in the middle of the 1980's could be a complete “IV” wave correction (a,b and c wave) of the whole century structure. Then the last “V” wave down started in the middle of the 1980’s and could still be in progress.
There are a few factors that make this interpretation less likely:
- The “IV” wave is short in time compared to the overall structure.
- The current negative sentiment is already at an historical extreme and difficult to sustain.
- Considerably higher prices in Europe than the US.
Trading vehicles
If you want to trade USD you could use the UUP (Ticker) which is a trading vehicle for the USD and simulates this currency. There are also leveraged vehicles to trade USD like the RYSBX (Ticker) which is leveraged twice the USD.
Conclusion
The wave pattern, the current sentiments reading and the configuration of commitment of traders could fuel a large USD rally.
Copyright © 2010 Geir Solem


