


I thought it was time for an update on the USD and to see how it is following my forecast in my article "Currencies - Long term forecast" where I analyzed the decline of the USD which started in the middle of the 1980's and continued until the end of 2009.
The 30 year structure revealed a triangle which I labeled as a large wave "B" that could be completed in a couple of years.
All charts in this article are courtesy of Stockcharts.com. Here is an updated daily chart of the USD over the last 2 years:
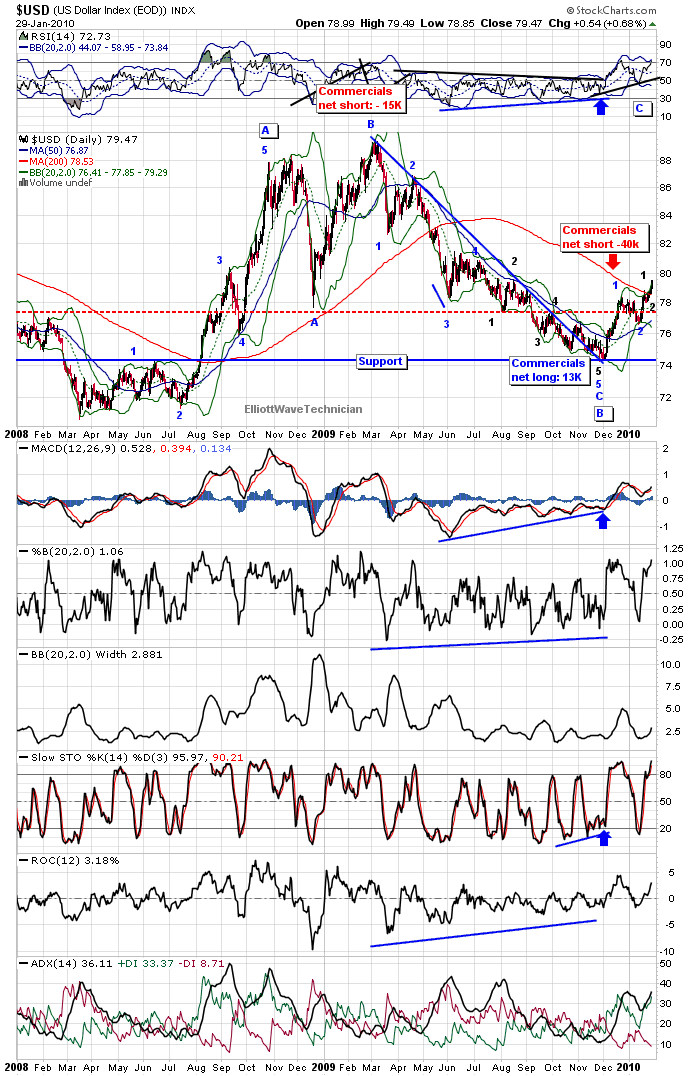
Notice that the commercials were net long over the last few months of 2009 positioning themselves for a rally in USD. The USD looks like it has completed a "B" wave correction. This structure is sub divided into a,b and c waves on the chart labelled with blue capital letters. You can see that the ending wave includes an extended 5th wave.
A larger "C" wave rally is in its early stages which should last a year or more.
It looks like the USD has completed the first wave 1 up as well as a correction in wave 2 which both are marked in blue colour. I use colours to show the different degrees of the Elliott Wave structure.
Currently it is rising in a small wave 1 marked in black. The next should be a small wave 2 correction. We have marked the area of the expected pullback in wave 2 in black colour on the chart.
Here is a close up look at the USD rally in a 60 min. chart of UUP (the UUP simulates the USD) that revealed the short term Elliott Wave Count:

A wave 2 correction ended 14th January 2010 and is marked with a blue "2". The USD is now nearly completing the first small wave of wave 3 (wave 1 of 1 of 3 marked in black colour) which should top in a few trading days and give way to a small correction.
The USD is tracing out a number of wave 1's of different degrees. Should the dollar continue to follow my forecast the next should be a dynamic and rapid rise in wave 3 over the next few months.
Trading vehicle for the USD
If you want to trade USD you could use the UUP (Ticker) which is a trading vehicle for the USD and simulates this currency.

The same pattern as in USD is evident in the UUP which is also tracing out a number of 1 waves of different degrees. Notice the strong volume during the last few weeks of 2009. A long term bottom is in place for the UUP.
There are also leveraged vehicles to trade USD like the RYSBX (Ticker) which is leveraged twice the USD.
Copyright © 2010 Geir Solem


