


Oil is the lifeblood of modern society, powering over 90% of our transportation fleet on land, sea, and air. Oil is also responsible for 95% of the production of all goods we buy and ultimately drives the natural rhythms of recession and recovery. We define this as the "Petro Business Cycle". (Click here for part 1)
Some have called it the “New Normal.” Others have difficulty explaining it. Economists are bewildered, as the old economic prescriptions don’t seem to work. Policy makers are equally perplexed. They’ve tried everything from fiscal fixes to massive monetary injections. They were able to arrest the decline, but the economy isn’t functioning as it should. Economic growth remains anemic; unemployment remains high, despite trillion-dollar deficits, trillion-dollar debt monetization, and zero-percent interest rates.
The result is that economic growth is well below normal, and still sputtering. The unemployment rate remains stubbornly high, and it will be years before it returns back to normal. We’re stuck in a low interest rate environment until inflation rears its ugly head. Part of the problem is debt. There is too much of it, which is why the private sector hasn’t responded; it is still in the process of deleveraging. The government has picked up the slack, spending vast sums of money to make up what the private sector can’t provide. Remove the government’s budget deficits, and we would be back in a recession. The business sector is also not responding well to the new environment, but its lack of response is mainly due to political uncertainty.
The business sector is sitting on vast sums of cash but needs policy clarity. That cash has remained stranded on the sidelines, as business leaders remain cautious regarding the uncertainty over taxes, government debt, and policy. The business sector remains financially healthy but lacks transparency from government. Washington has become business unfriendly, and it isn’t quite clear where the next crisis will appear. So we’re stuck with subpar economic growth, high joblessness, and various explanations as to why policy isn’t working.
There is something else at work here other than just debt. The economy and the markets haven’t been acting normal. Over the last five years, the economy continues to hobble along, with brief spurts of growth as more monetary injections are applied in an effort to keep economic engines humming. However, the real beneficiary has been financial assets, with the stock market hitting new records, and having risen more than 130% since the March 2009 lows.
The Limiting Factor: Energy
Why hasn’t the economy responded to the largest fiscal and monetary stimulus in history? I believe the answer can be found in the energy sector. The era of cheap energy is over. Higher energy prices are now the dominant factor governing economic growth. Without cheap energy, economies globally struggle to grow. The world has changed: the engines of growth are no longer the developed world. Emerging markets, especially the BRIC countries, are now the drivers of the global economy. The consequences are that demand for energy has increased and the producers of energy are struggling to keep up with that demand. The combined economic growth of the developed and developing world has placed enormous strains on the energy sector to meet those demands. The result is higher oil prices, and it is those higher energy prices that have put a governor on economic growth.
OPEC no longer has the spare capacity to ramp up production to meet the demands of an emerging world. OPEC’s spare capacity has shrunk from 8-10 million barrels in the late 1980’s to today's estimate of 1.5-2.0 million barrels. That is not enough to bring down prices, thus leaving the world vulnerable to exogenous shocks like the Arab Spring, which took 1.6 million barrels of Libyan oil off-line, producing another oil shock. That shock took its toll on economies and markets around the globe. The limiting factor on economic growth has now become the market price for oil. If OPEC has influence on oil, it comes in the form of limiting the downside risks through production cutbacks. Increasing production during a crisis is now limited, as many members are past peak production.
Watch Out for Those Shocks!
The impact of higher oil prices on global economies is nothing new. James Hamilton has even shown that "All but one of the 11 postwar recessions were associated with an increase in the price of oil," with the only "single exception being the recession of 1960." You can see this dynamic playing out below as downside swings in U.S. GDP highly correlate with oil shocks and sustained increases in price.

Source: Bloomberg
Historically, it began in the 1970’s with the Yom Kippur War, and the oil embargo that followed in its wake. It was a contributing factor to the back-to-back recessions of 1979 and 1981, following the Iranian Revolution in which oil prices spiked to a barrel for the first time. The same impact followed the First and Second Gulf Wars. A threefold increase in oil prices played a contributing role in the recession of 2001. Few analysts acknowledged the role of oil as a factor behind the rise in inflation forcing the Fed to raise interest rates in 1999.
The price of oil tripled during 1999, which was a big reason interest rates rose that year, and bond prices fell. Increases in the price of oil have also led to sharp corrections in the stock market. Spikes in the price of crude preceded or accompanied stock market declines during 1987, 1990, 1994, and 2000, as well as 2007. The impact of a spike in oil prices can been seen below in both of the bear markets of 2000-2002, and 2007-2009.

Source: Bloomberg
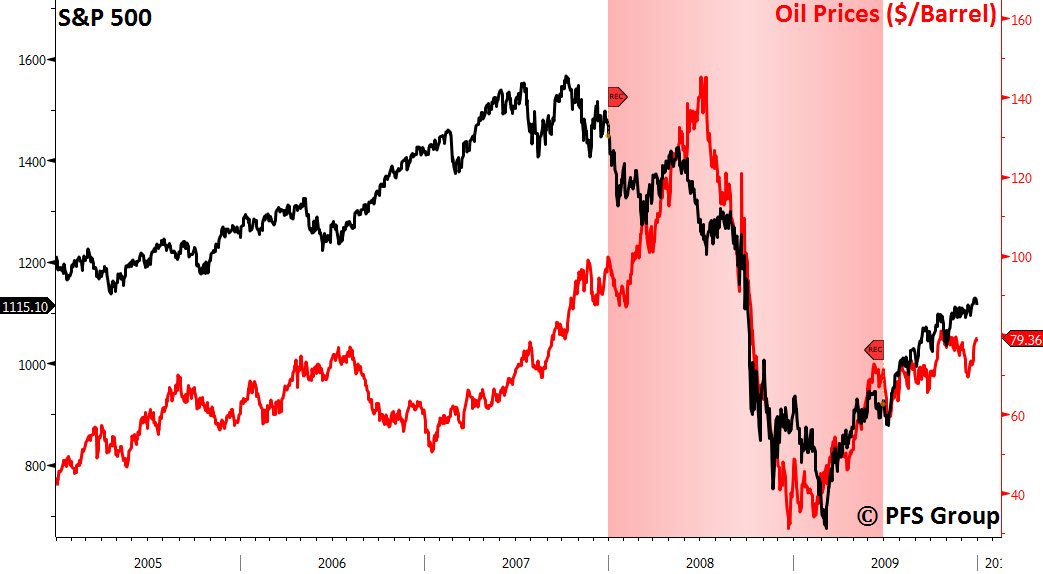
Source: Bloomberg
Even though commodity prices started to rise during both of these periods, it was obvious that one commodity, oil, played a key role in both market tops and bottoms.
The role that oil plays in regulating economic growth has accelerated over the last decade, and is still not clearly understood, especially in its role as a contributing factor in the 2001 and 2007 recessions, and the subsequent subpar economic growth that has followed in its wake. The price of oil has gone up fivefold since the beginning of the last decade; despite the quintupling of oil prices since then supply is struggling to keep up. Economists and policymakers remain hopeful that new discoveries projecting vast amounts of new oil to come on-line will eventually meet our energy needs. A growing optimism over the role of renewables and technological advances, such as horizontal drilling and fracking, which has unleashed the shale oil and gas boom, is hoped to fill the gap left by rising depletion.
Yet the price remains stubbornly high.
Experts now admit that conventional oil peaked in 2005-2006; unconventional oil has taken its place, however, it is more expensive to produce and one reason why gasoline prices have gone up globally over the last five years.
The "Undulating Plateau"
Experts such as Daniel Yergin at Cambridge Energy Associates believe unconventional and yet-to-be discovered oil will fuel global economies well into the next decade. Even then Yergin expects other sources of energy to take their place. Yergin envisions a period he calls an “undulating plateau” for crude oil, in which new discoveries and technological advancements keep the world supplied with energy.
Could it be that what we are seeing today is Yergin’s thesis of an undulating plateau, a decade before its predicted arrival?
In my opinion, experts like Yergin and the energy industry continue to make a serious mistake by providing wildly optimistic scenarios for US and global crude oil production. The IEA’s World Energy Outlook 2012 is a good example of this overly optimistic myopia. In their 2012 Outlook, the IEA projects US oil production to surpass Saudi Arabia by 2020 to become the world’s largest energy producer and a net energy exporter. Data supplied by the EIA and BP show global crude oil production and global total liquid production has averaged around 0.5% a year. Additionally, in a study of the world’s largest net oil exporters, the top 33 exporters show a drop in net exports from 46 mbpd to 43 mbpd by 2010. Yet, in the IHS study, titled, “The Future of Global Oil Supplies,” Yergin’s group projects oil production will rise from around 90 mbpd to 115 mbpd by 2030, and remain at that level until 2050. They also acknowledge that world depletion rates are around 4.5% a year, necessitating new oil discoveries of 3-4 mbpd just to stay even. If net exports have been falling, as shown in the graph below, where will the 3-4 mbpd needed to replace depletion and the growth of 2.5% non-OECD demand come from?

(Source)
The world is relying on false hopes of new discoveries and technological advancements to fill the gap between conventional oil and the demand for energy. Is this a realistic assumption? Newly discovered oil and unconventional oil is very expensive to drill and produce, not to mention the dangers of drilling and producing it (i.e. Deep Water Horizon); think of the tar sands, deep water, and shale oil plays. Unconventional oil plays like this require not only vast sums of money, but end up requiring much higher oil prices to remain profitable.
Yergin and the IEA have given the world a false sense of security in my opinion. As mentioned previously, the IEA is now projecting that the U.S. will become the world’s largest producer of oil by the end of the decade, surpassing the former Soviet Union and Saudi Arabia. Although U.S. energy production has increased by one million barrels since 2007, that production is unlikely to replace the nearly 9 million barrels we import each day. In their optimistic predictions over future oil production, the IEA also warns that the world is failing to put the global energy system onto a more sustainable path. Global energy is expected to grow by more than one-third by 2035; most of that growth will come from the emerging world, with China, India, and the Middle East accounting for 60% of the increase. Energy demand in OECD countries is expected to barely rise during that same period. In fact, it has been the anemic economic growth in OECD countries and the contraction of demand that has allowed the emerging world to pick up the slack. Otherwise, we would be looking at much higher oil prices.
The Price of Growing Consumption
According to BP’s 2030 Energy Outlook, non-OECD energy consumption will account for 93% of all energy demand growth by 2030, with growth in consumption averaging 2.5% per year, accounting for 65% of world consumption (compared to 53% in 2011).
Another problem is that OPEC is consuming more of its own product, as shown in the table below, which illustrates the strong consumption demand for crude within OPEC’s main producers. Many OPEC countries subsidize the price of oil, thereby increasing the demand from its own citizens. This gives rise to what Dallas geologist Jeffrey Brown calls “The Export Land Model,” which models the decline in oil exports that result when an exporting nation experiences both a peak in oil production and an increase in domestic oil consumption; this can be clearly seen in the table below. Saudi Arabia now consumes more than 10% of its own production, which has yet to exceed ten million barrels. Other large OPEC producers like Iran and Venezuela are consuming 42% and 30% of their production, respectively.

Source: BP Statistical Review
In summary, the reason that economic growth remains anemic, and the recovery from the global recession of 2007 has been subpar, is mainly due to the end of cheap oil. The energy industry is struggling to keep up with demand due to the following factors:
- Depletion rates are rising as older giant energy fields go into decline
- We need to discover 3-4 million barrels a day just to replace the barrels we are losing to depletion
- Unconventional oil is more expensive to find and produce, requiring far greater sums of money for investment
- The world is still failing to make the necessary energy investments to put the global energy system on a more sustainable path
- The vast majority of the world’s energy reserves—well over 60%—are held within OPEC countries
- OPEC is consuming more of what it produces
- A false sense of security and reliance on renewables; fossil fuels will remain the dominant source of energy within the global energy mix well into the middle of this century.
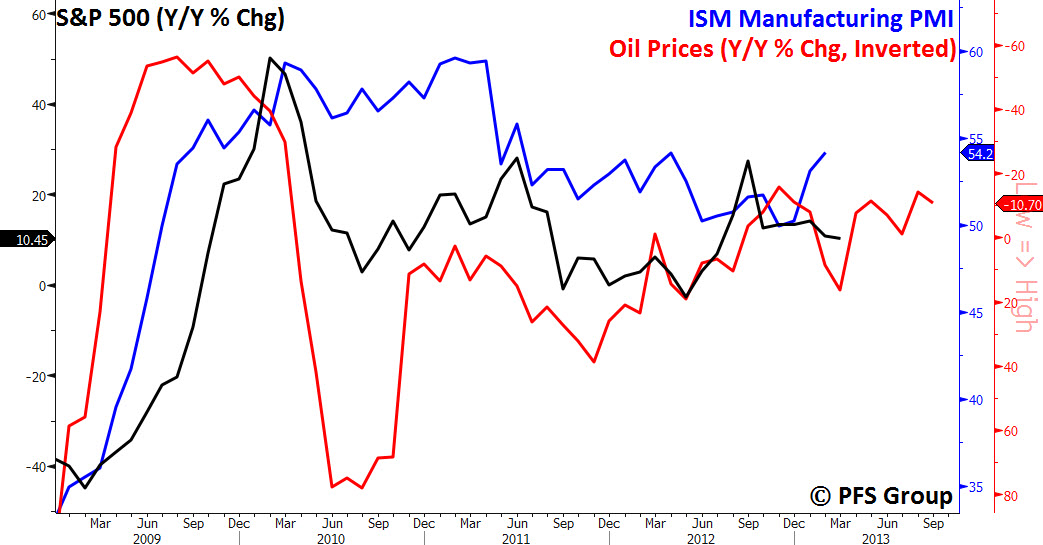
In light of the above, the economy and the markets since 2007 can be seen from a different perspective. The graph below depicts the price of oil (inverted), the ISM Manufacturing Index, and the S&P 500 since 1999.
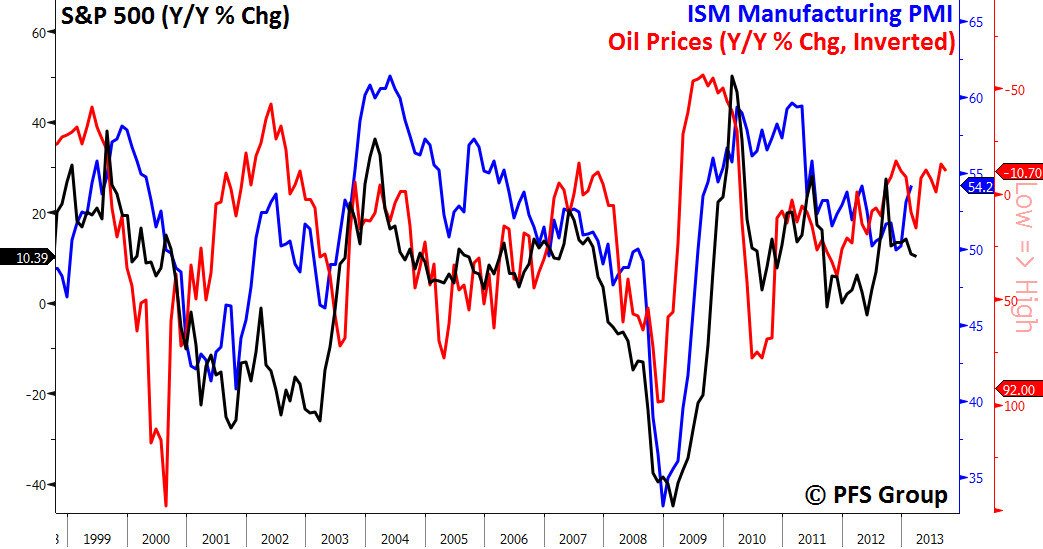
Source: Bloomberg
As you can see, over more than a decade the market, economy, and price of oil have moved in a highly coordinated and cyclical fashion, with oil serving as the tipping point between major swings. It was for this reason that I initially wrote Petro Business Cycle to highlight this dynamic and consider its investment implications moving forward.
As I explained in Part 1, what we are experiencing is a shortened one-year business cycle that has been repeating itself since 2010 to the present. We start the year with stronger economic growth followed by a rise in asset prices. Wall Street refers to this as the “risk on” trade. Eventually, as oil prices begin to rise they start to flow through the economy, beginning with the prices-paid component of the regional ISM and the regional Fed surveys. Eventually, prices get passed onto consumers as inflation rises and, along with it, interest rates. Rising prices begin to exert an influence on slowing down the economy as consumers cut back on discretionary consumption as inflation exacts a toll on spending. The result is that the LEIs rollover and the economy weakens. This takes the pressure off energy and prices begin to decline and along with it inflation.
Investment strategist Francois Trahan of Wolfe Trahan has written about this in his book “The Era of Uncertainty: Global Investment Strategies for Inflation, Deflation, and the Middle Ground.” Trahan posits the investment theory that in an age of zero interest rates, inflation has become the new federal funds rate. When inflation falls, it acts as a stimulus, much in the same way that lowering interest rates did in the past. Likewise a rise in inflation simulates the same effect as a rise in interest rates.
My only difference from Trahan is my emphasis on oil as the key factor in this process. It is my belief that more than anything else, including vast monetary injections, the rise in oil is due more to the gap between demand and production and our inability to bridge this gap. This I believe is the first warning sign of approaching peak oil. If a fivefold increase in the price of oil can’t bridge the gap in production what else will?
As investors we must now turn our attention to how to ride out the undulating plateau of oil and its impact on economic and market cycles. We can draw major clues from the last two recessions and bear markets. The cycle pattern has been virtually the same.
In 1999 the price of oil began to rise. Over the next two years the price of crude more than tripled. Rising oil prices were followed by a general rise in commodity prices. This led to a top in the bond markets with prices peaking in January of 2000. The rise in commodity prices prompted the Fed to start raising interest rates during the middle of 1999. Eventually, the rise in oil and interest rates led to a top in the financial markets the following year. Commodity prices were the last to peak topping out in October of 2000 and producing a triple top, which ended in February of the following year. The October peak in commodities signaled the economy was in a recession. In fact NBER dated the onset of the recession as having begun in March of 2001, the first contraction. It was one of the shortest recessions on record having lasted no more than eight months. The recession ended in November of the same year. What ended the recession? I believe it was the sharp drop in oil prices as shown in the graph below.
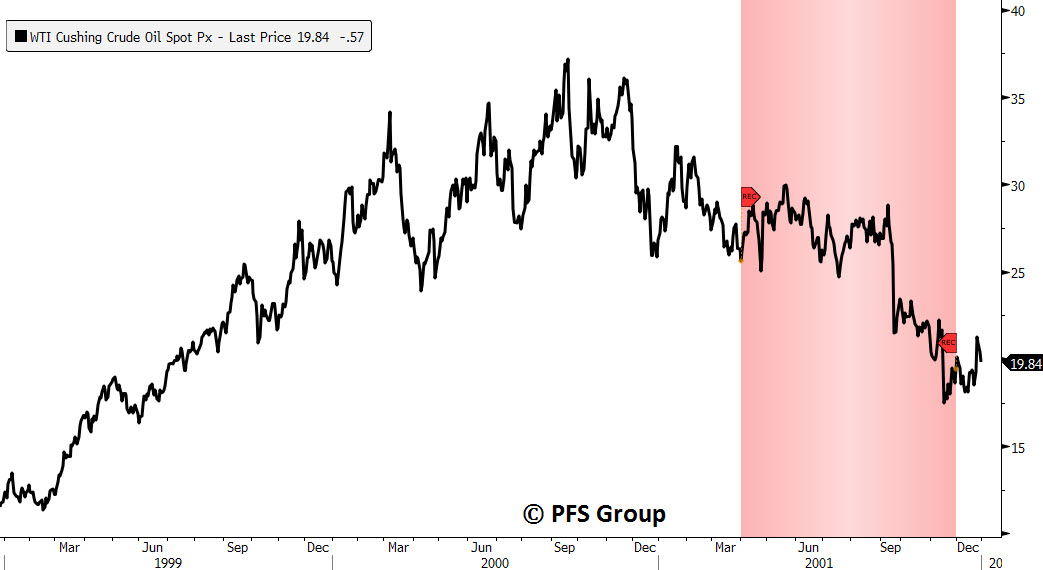
Source: Bloomberg
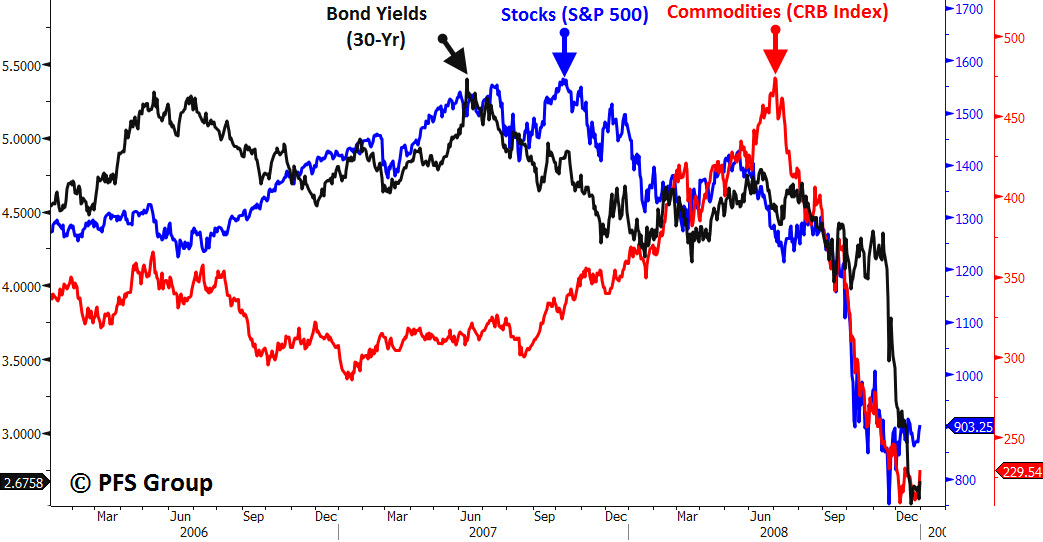
So we now have a sequence that we can follow that has played itself out in a repetitive pattern. It began with a top in the bond market in early 2000. The top in bonds was followed by the next top in the stock market in April, and finally it ended with a top in commodities in late fall and early winter of 2000 and 2001. The successive sequence in tops can be viewed in the following graph, which shows bonds topping first, followed by stocks and ending in commodities.

Source: Bloomberg
Play It Again Sam
We would see this same sequence play out again in the next market top and recession. Oil prices began to rise steadily in 2003 but they were offset by loose monetary policy and robust global economic growth generated by the emerging economies. The sequence took longer to play out with bonds peaking in the summer of 2007 followed by a peak in stocks in October of the same year. Commodity prices took the longest to peak topping in July of 2008. They were driven higher led by rising record oil prices, a result of emerging market demand.
Source: Bloomberg
Since the recovery began in the spring of 2009 we have seen shorter versions of this cycle play out over the last four years as shown below.
Source: Bloomberg
The eight steps of the Petro Business Cycle repeated below I believe account for much of what we see happening in the rotation between sectors of the market.
- Fiscal & monetary stimulus is applied to the economy
- Economic growth accelerates as a result of stimulus
- Demand for energy picks up as global GDP growth picks up
- Energy prices rise along with energy demand as supply struggles to keep pace
- Rising energy prices cause the prices paid component to rise leading to a rise in both the PPI and CPI
- Rising inflation feeds through to the economy—LEIs begin to peak and roll over
- Falling LEIs lead to slower economic growth and falling equity markets
- A weakening economy and faltering equity markets force another policy response and the cycle repeats itself
We’ve seen this eight step process play out repeatedly since 2010. The year began with strong economic growth following another dose of monetary stimulus. In 2010 monetary injections from QE1 and the combination of the President's stimulus program were driving economic growth until the summer of 2010 when the economy began to slow down. The combination of private sector debt and rising energy prices caused economic growth to sputter. The result was that in the fall of 2010 the Fed announced QE2, and economic growth began to pick up again until the summer of 2011 when QE2 ended. By the fall of 2011 the economy got another shot in the arm with falling interest rates as government bond yields fell as a result of the migration out of European debt, due to the crisis in Europe. Economic growth picked up again in Q4 and remained strong until late spring in 2012, when oil prices peaked during the first week in May.
Oil prices have been rising since early November of last year. The CPI has ticked up, and the prices paid components within the regional Fed surveys and ISM reports are rising again. Inflation is on the rise in China and the government is starting to place restrictions on the real estate sector in an effort to keep the real estate bubble from overheating further. In the US the economy is sputtering again. The government just reported that GDP growth in Q4 was only 0.1%. Despite the announcement of QE 3&4 economic growth remains anemic. The ECRI is claiming we are now in a recession that began in the final quarters of 2012.
If we are in danger of a recession then we should expect to see the following pattern: Bonds should peak first, followed next by a peak in the stock market, and finally a top in commodities. The only sector that has peaked so far is bonds, which reached a bottom in July of 2012. The stock market continues to rise to record highs driven by vast amounts of liquidity and negative real interest rates. Are we headed for danger of another recession? If so the patterns of 2000-2002 and 2007-2009 should reoccur. Or could we experience another growth slowdown as we did in 2010, 2011, and 2012, only to be followed by more injections of either monetary or fiscal stimulus. Time will tell. Central banks can create oceans of money that can drive asset markets higher. What they can’t do is create barrels of oil, which is what powers our industrial economies. Welcome to the new world of the Petro Business Cycle.


