


While numerous events portend future global and economic turmoil, successful investing warrants a close examination of the dramatic effects central bank intervention and money-printing have on financial assets in the midst of major bear markets.
We’re less than one year away from December 21, 2012, the date that the ancient Mayan calendar allegedly marks as the end of an era and, in some investors' minds, the collapse of society as we know it. Although not quite apocalyptic, Wall Street soothsayers are also less than optimistic about the future state of the market.
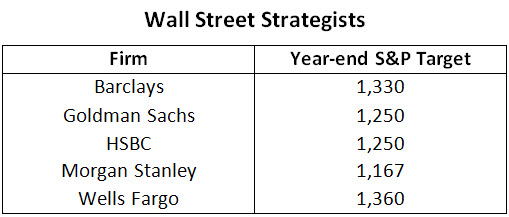
Forecasts made at the beginning of the year were certainly more bearish this year than any time I can remember. The consensus is far more downbeat with Morgan Stanley’s Adam Parker predicting a year-end close of 1,167 for the S&P 500. Even Goldman Sach’s forecasts for 2012 were more subdued than usual calling for a close of 1,250 for the S&P, essentially a repeat of last year’s results of a stock market that is zero bound.
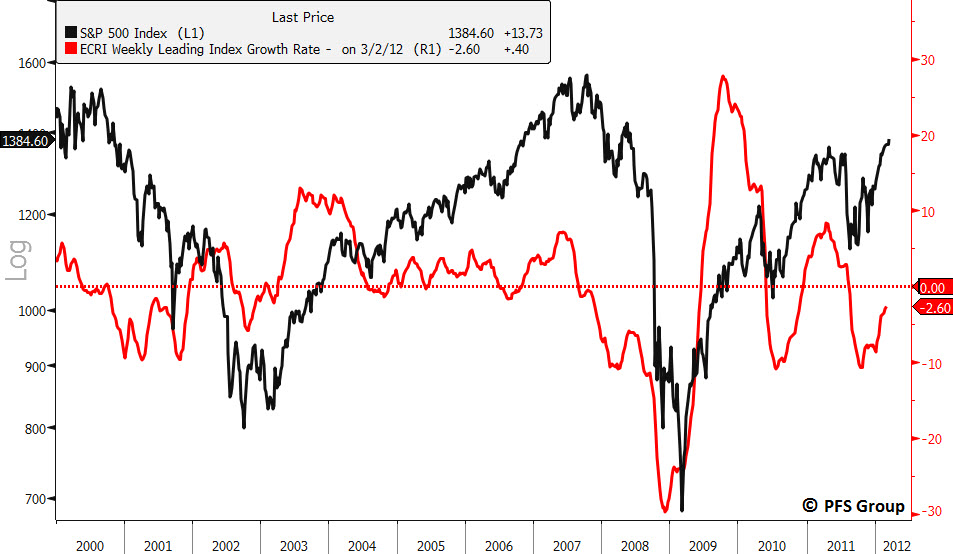
The old cliché that a bull market climbs a wall of worry seems to be playing out this year. Of course, despite the plethora of worries things have been steadily improving. The S&P 500 is up high single digits and the economic data continues to surprise on the upside. Still, the worries persist. Last October the stock market bottomed on October 4th, and the VIX peaked on August 8th at 48 and then again on October 3rd at 45.45. At that time there were multiple worries from the debt ceiling and downgrading of U.S. debt, a double-dip U.S. recession, a meltdown in Europe, a hard landing in China, the ECRI’s recession call (which is still being maintained), to social unrest as exemplified through the “Occupy Wall Street” movement.
By year-end most of these worries were beginning to resolve themselves. The economic data began to show an improving economy in the U.S., the ECB expanded its LTRO program, and China’s central bank reversed their position from tightening to one of easing. The leading economic indicators which bottomed in October reversed course and have been rising ever since. The improvement in the LEI’s has been corroborated by a similar improvement in the national ISM manufacturing and non-manufacturing surveys.

If there is a recession in the cards it doesn’t appear imminent. We follow three main anticipatory indicators in gauging the direction of the U.S. economy: the Wolfe-Trahan WTLEI, the ECRI LEI, and the Recession Alert Weekly SuperIndex. All three of these gauges continue to point to an improvement in the economy as shown in the graphs below.

Source: Wolfe Trahan & Co.
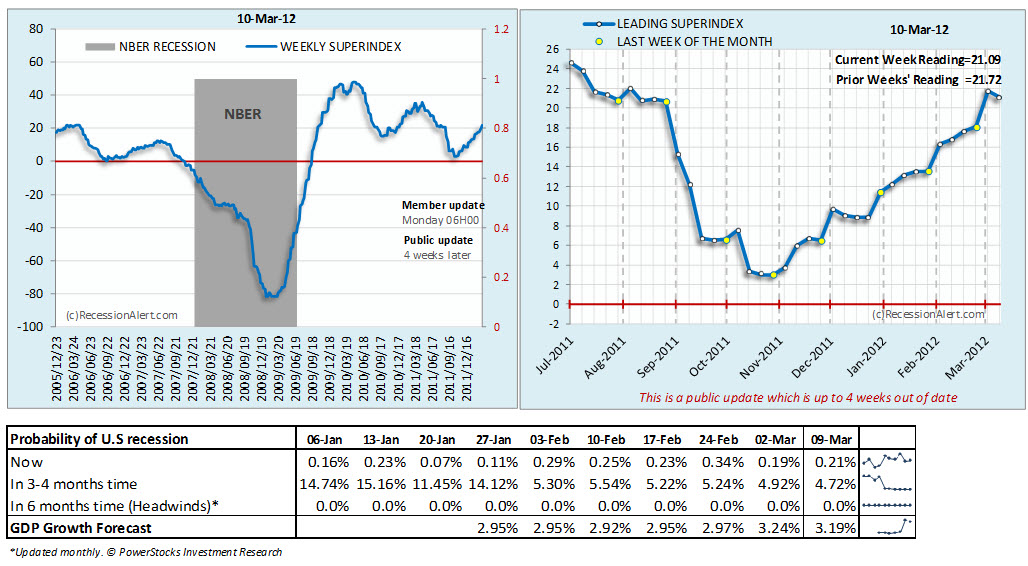
Source: RecessionAlert.com
In fact, supplemental data from last week continue to support the case for a strengthening U.S. economy:
1. Unemployment claims: 355k: 4-year low
2. ISM Non-mfg PMI 57.3%
3. Vehicle production: + 19% q/q a.r. in 2Q
4. Vehicle sales: 15.0 m, a 4-year high
5. Mfg IP: + 0.8% in January
6. Consumer Credit .8 billion
7. Total payrolls rose by 227,000 in February
Even more critical to the economic recovery is the fact that general inflation remains subdued as reflected in the monthly ECRI Future Inflation Gauge, which remained unchanged at 101.4 in February. Francois Trahan at Wolfe Trahan maintains that in a zero interest rate environment inflation has become the equivalent of the fed funds rate. A lower inflation rate means that consumers have more purchasing power than when the rate of inflation is rising.
Given the improving data on the economic front it should come as no surprise that stock prices are up this year. Even more revealing is the performance of the various sectors within the S&P 500. As shown in the following table those sectors that are outperforming the general index are the very sectors that would do well in an improving economy.

Given the above, the next logical progression of this data should be a continued improvement in corporate earnings. Current consensus earnings for the S&P 500 Index are 5.13, reflecting a growth rate of 8.61% over the previous year. What if earnings surprise on the upside? If the economic data point to an improving economy it would make sense that earnings follow suit. Also, keep in mind that estimates going into the year were conservative given the plethora of worries heading into the end of last year.
Regardless of currently improving data, however, there are numerous firms that are still calling for a lower close on the S&P 500 by year-end.
While a bearish case can be made as to why the stock market should head lower, successful investing warrants an appreciation for the effects of aggressive central bank intervention and, most importantly, historical market cycles.
What is often lost in many of the bearish arguments we read is that you can have a cyclical bull market within a long-term secular bear market. For example, there have been three major secular bear markets over the last 100 years: 1929-1954, 1966-1982, and finally 2000-present. In each of these long-term secular bear markets there were numerous cyclical bull markets contained within a long-term bearish trend. When the Great Depression is discussed one detail often left out is the great bull market in stocks between the years 1932-1937. Yet, within that great bear market of the 1930’s, after bottoming in June of 1932, the Dow Industrials advanced from a low of 41 to a high of 194 by March of 1937, a gain of 370%. When you think of the Great Depression a four-fold increase in stock prices probably doesn’t come to mind. In addition, there were several other cyclical bull market advances in 1942-1946, and 1949-1952, as seen in the chart below.

Source: Bloomberg
The next secular bear market of 1966-1982 more closely resembles what we are going through today. The government was running large budget deficits as a result of the “Great Society” programs of the Johnson era and the Vietnam War. The Fed, under Arthur Burns was printing money, as the Fed is doing today. It was also an era of rising oil prices and oil shocks. The rise in oil along with Fed money printing helped stoke the inflationary fires. By the end of the 70’s inflation rates were over 14%. Like the great bear market of the 1930’s, there were five cyclical bull markets contained within the time frame of a sixteen year secular bear market. Although the Dow Jones Industrial Average went nowhere for sixteen years, there were five cyclical moves with double-digit gains as high as 64%.
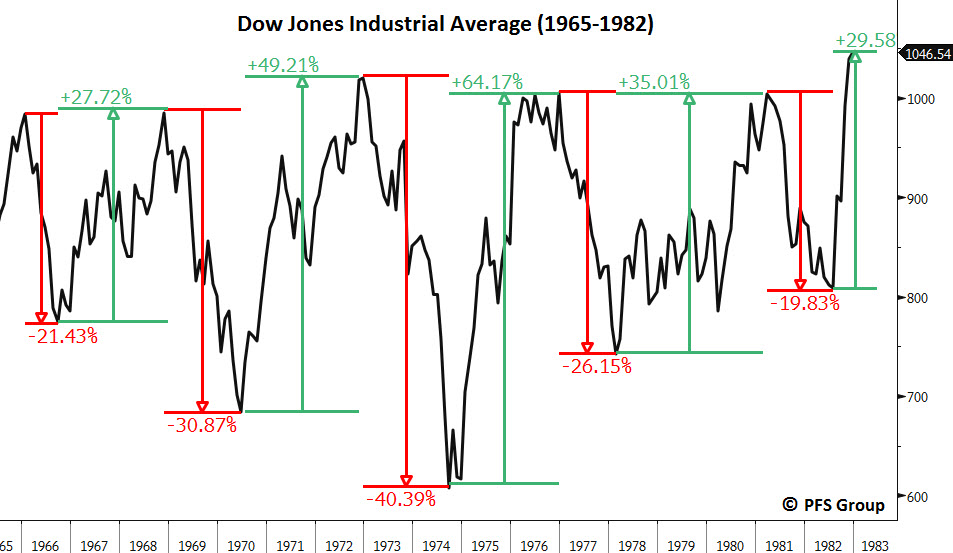
Source: Bloomberg
Let's now turn our attention to the present and look at the Dow over the past 12 years. It peaked in January of 2000 at 11722, and then again in October of 2007 at 14093. In between those two peaks were bear market declines that saw the Dow Jones lose 38% from 2000-2002, and 54% between the high of October 2007 and the bottom of 2009. However, had you gotten completely out of stocks following those two bear markets, you would have missed out on two major moves that produced gains of 94% and 101% respectively.

Source: Bloomberg
What history has taught us is that recessions and bear markets produce countervailing moves by government in the form of fiscal and monetary stimulus. Argue what you may as to their economic benefits, what we do know is that they have a significant impact on the direction of the stock market. When money is created by fiat through monetary stimulus or fiscally through government spending, that money has to go somewhere. If it doesn't end up flowing into the economy, it will almost certainly show up in financial assets. Unfortunately, those who maintain large cash positions during these inflationary countermoves get hit twice as hard. First, by a loss in the purchasing power of their money and second, by not participating in the inflationary induced rallies. To add insult to injury, the average investor usually doesn't figure this out until a level of euphoria has finally priced in a stock market peak, which is where too many end up buying only to sell after the market once again corrects.
Coming back to the present, I believe the public is once again not seeing (or refusing to hear) an important story being told with a strong breakout in the Nasdaq, technology stocks, and blue chip stocks as reflected within the Dow. There is something happening here that nobody is talking about that goes much deeper than the shining success of Apple.

Source: Bloomberg
From the lows reached last August, Cisco shares are up 49%, IBM is up 28% and at a new record high, Intel shares have risen 41%, and finally even Microsoft is up over 35%.
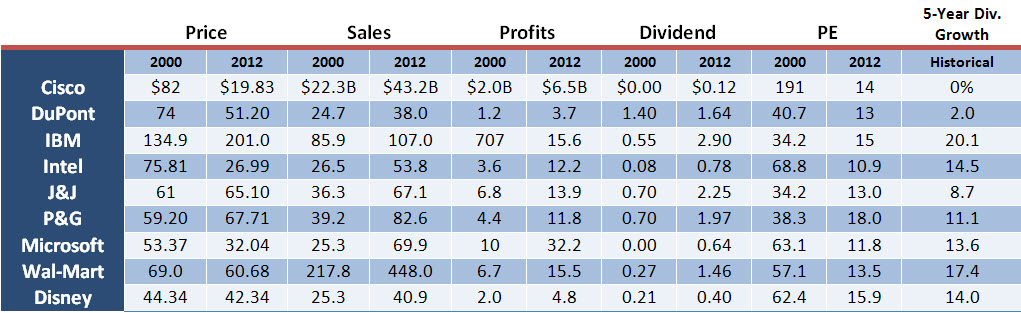
What I find astounding is the fact that there was no price too high that investors were willing to pay to own these stocks back in 2000. Now, twelve years later with sales and profits up three and four-fold nobody wants them. Furthermore, many of these companies are selling at lower multiples and now sport attractive dividend yields that rival treasuries.
For example, in 2000 Microsoft sold for 63 times earnings, Intel had a PE of 69, Cisco’s PE was 191, and IBM sported a PE multiple of 34. Also, Microsoft and Cisco didn’t pay a dividend while the dividend on Intel and IBM was negligible. Today, Intel’s dividend yield is 3.1% and growing at an annual rate 14.5% over the last five years. Similarly, Microsoft, which paid no dividend back then, has a current dividend yield of 2.25% increasing at an annual rate of 14%. Cisco now pays a dividend that is growing each year and IBM’s dividend has been growing at an annual rate of 20%.
As shown in the following table, many techology companies that make up the Dow still show prices well below their 2000 highs. IBM is the only one that has seen a substantial move in its share price over the last decade. Most of IBM’s move has occurred since 2008 after bottoming at .88. Since that time the stock price has advanced 168% as profit margins and dividend hikes have grown by double digits.
Data Sources: Bloomberg, Valueline
Nobody would argue that these companies, given their present size, will experience growth rates similar to what occurred during the tech and stock market boom during the 1990’s. However, most of these companies are seeing sales and profit growth in the high single or low double-digits. Not bad for a dominant franchise, not to mention the strong economic moat that many of these companies enjoy.
There are many who can cite numerous reasons why another severe downturn is in store for our future: with a possible military strike against Iran, another financial crisis (this time a sovereign one), rising oil and gasoline prices, massive tax hikes hitting the U.S. economy in 2013, a run-a-way global printing press, to another weather related event or an act of God. Of the potential risks just mentioned, the ones that concern us most are rising energy prices and the massive tax hikes due to take effect next year.
However, we have learned to view the economy and the markets in a six-month time frame; remaining flexible and willing to adapt to the ever-changing environment is key.
Along those lines, if one had to choose between locking in a 10-year treasury yielding 2-3% and a similar dividend yield growing at 10-20% per year, the choice is pretty obvious; in which case an investor also stands a much better chance of keeping pace with actual rates of inflation and a potential increase in interest rates. If there is a bubble out there waiting to burst it certainly isn’t the stock market. With inflation running at high single digits, government deficits at record levels, and central banks around the globe resorting to massive money printing I believe the next major bubble is the sovereign debt markets.
When that will happen—one, five, or ten years from now—nobody knows for sure. What I do know is that people still need sound investment strategies to meet their present needs, the economy continues to show improvement, company earnings are rising, and stock prices continue to head higher. This is the story that nobody wants to hear.


