


What is it?
The Danielcode is an ancient and mystic sequence of numbers stretching from zero to infinity. It predates the Fibonacci sequence by 18 centuries. I first came upon it 10 years ago while testing the market significance of squares and roots of historic numbers.
The Danielcode was originally written as a timing mechanism for the Jewish people. These are Daniel's words from the Bible:
Dan 12:12 Blessed is he that waiteth, and cometh to the thousand three hundred and five and thirty days.
In sacred geometry, numbers and sequences have multiple meanings. The number 7 can mean 7 days, weeks, years etc. It can also mean 70 or 700 so the decimal point can slide. The square root of 1335 is 36.537. If we slide the decimal point we get 365.37 which is an astonishingly accurate measurement of a calendar year.
A calendar year is 365.25 days decreasing by 100 picoseconds a year over long periods. I will save you the math and tell you that the current variance from Daniel's number without adjusting for the change in the earth's rotational rate is less than 3 seconds per year!! To put this in perspective, a modern quartz watch spec will say that it will keep to +-15 seconds per month or an error of 180 seconds per year! As this gem was granted to us in about 620BC, a time when sundials were the most accurate measure of time, (and a modern sundial can vary as much as 16 minutes per hour from a truly accurate clock; the sun is not as accurate as you think), I was left with the questions "How can this be and does it have any application to modern markets?"
How does it work?
From the Daniel number sequence I created a series of ratios in the same way that Fib ratios are created by relating successive numbers in the sequence. Where Fibs are approximates in market lore, the Daniel ratios seem exact to a few ticks!! There is a self fulfilling quality about Fibs in financial markets. Since they are taught to most traders and are the basis of several trading methods we have a market expectation of support and resistance at these levels. Until today only a handful of people anywhere, have heard of the Danielcode so I have the benefit of working with a unique sequence of numbers that are not apparent to others. It follows that at crucial turns the Danielcode will create signals different from all other forms of analysis.
The theme of this article is that the Daniel sequence creates significant numbers that markets recognise but others do not see.
The Danielcode as a universal time keeper has affinity with all financial markets. Those familiar with Gann's assertion of time equaling price and being interchangeable on the square will understand how a timing mechanism can be engineered to create price levels.
Having created precise price levels that nobody else saw, I needed a practical insight of what these levels meant in real time to investors. A new and exciting discovery should be more than of academic interest. To my simple and now somewhat aged mind an analysis which says "Pattern A means higher prices and the alternate pattern B means lower prices" tells me little. I am not being critical but my mind doesn't work that way. I need to know beforehand and with a high degree of certainty, the answer to just 2 questions:
- Is the correct position in this market long or short?
- What is the precise (to two decimal places) price action that will change this call? These are close by, market numbers; not patterns.
The answer when it came was simplicity itself, but it is only the precision of the Daniel numbers that makes this approach possible.
For the past 2 years I have published my analysis of currency markets based on the Daniel sequence to a handful of private corporate clients who have used it for their currency hedging with spectacular results. I now have sufficient documented, published reports, and live execution of these strategies to credibly share this information with a wider audience. I thank Financial Sense Online for this opportunity.
Pacific Currency Examples
As an introductory article on the practical application of the Daniel numbers to currency charts, let us examine the Danielcode levels and their calls on the New Zealand Dollar-US Dollar cross (NZD-USD) from June 2006. As a small country of just 4 million people with a predominantly rural based economy featuring primary production (dairy and lumber) and an urgent need to export, New Zealand sensitivity to currency fluctuations is high. As a westernized country with high living standards and cost of labor, pressure from input costs is constant. New Zealand's major trading partner is Australia but USD and Yen crosses are highly significant to terms of trade. Being a high yielding currency, the NZD has attracted interest from the carry trade as has the Australian Dollar. The relative size of AUD and NZD makes them vulnerable to savage reversals which heighten the need for timeliness and accuracy in a cohesive hedging or investment strategy. On these crosses you are either dead right or dead!
This is the weekly NZD-USD chart for the relevant period:

The range runs from 59.23 to 81.09 in a 16 month period, a rise of 37% followed by a 15c retracement in 4 weeks. Volatility indeed!!
Australian and New Zealand exporters must hedge. To run a successful hedging strategy during this period you needed to know with a high degree of certainty that March and June 2006 were indeed the lows and that July 2007 was an important top.
On 26 March 2006 I published the following chart to my clients. The last level of Danielcode support was identified at 60.80. The two closing lows in March and April were 60.80 and 60.82 respectively and the buy signal subsequently ensued.

One of the quirks of the Daniel numbers is that they can complete their targets on either a high/low bar or close only basis. This is how the close only chart looked subsequently:

Few others saw this turn coming as the New Zealand Herald of 19th September 2006 noted, lamenting the NZ Dollar/US Dollar rally from June 2006:
Exacerbating the potential economic downside of the dollar's recent gains was the fact that foreign exchange cover taken by exporters over the last three months had been negligible. When you have both the banking community and also the central bank all forecasting a lower currency it's not an environment where exporters who have struggled with a strong currency for a long time are apt to be aggressive in their hedging requirements."
Export New Zealand chief executive Bob Walters agreed. "I would say exporters probably have been wrong footed by most of the advisers," he said. "Was there any expectation from anywhere or any signal that it was likely to creep up around where we are today? I'd say the answer was no."
I can say that the answer to Bob's question was actually YES!!
Having identified both the intermediate highs on the run up, I issued the following Alert on 25 July 2007 at 11:09 AM NZ time:
"With all of the markets we follow at Danielcode target levels, we are at a position where a universal currency reversal (sic: for our markets) could occur. I had advised this setup was likely to occur around the 2nd week of July so we are within the expected time frame. Traders and Hedgers should closely monitor reversal points set out in the weekly commentary and have a clear plan of action if the reversal signals are elected."
As background the Australian Reserve Bank had just raised rates again and Bank and media comment was that AUD and NZD would continue to appreciate due to strengthening of interest rate differentials!
Nobody saw this coming!
This is where NZD, AUD and GBP-NZD were on that date. These targets had been on the charts for months.
NZD-USD

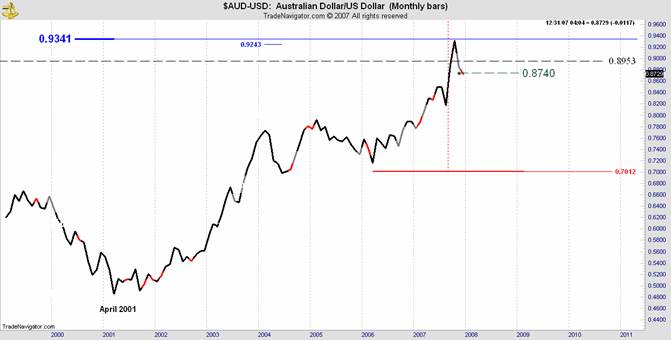
AUD-USD (remember this chart)

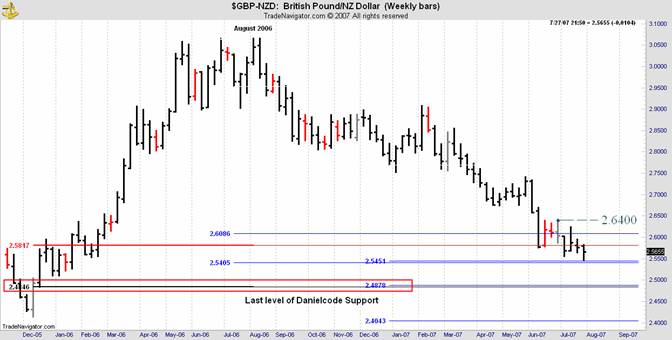
GBP-NZD
What happened the next day and in the next 4 weeks to these crosses and the variances from the Daniel levels is set out in the next three charts from my 17 August 2007 report.
NZD-USD Certainly out of favour

AUD-USD Also unloved and unwanted.

GBP-NZD Is at Danielcode targets.

You will note that the actual highs/lows on the turn were in all cases made a matter of ticks from the Danielcode levels.
Bloomberg reported as follows:
Aug. 20 (Bloomberg) -- A doubling in currency volatility since June has knocked the ‘‘carry trade’’ off its perch as the most profitable strategy in foreign exchange, hurting investors from John W. Henry & Co. to Campbell & Co.
In one of the more popular carry trades, a U.S. investor who borrowed in yen to buy high-yielding Australian dollars enjoyed a return of 11 percent this year through June 5, data compiled by Bloomberg show. The gains have since been wiped out.
‘‘We were caught off guard,’’ said Terri Becks, president and chief operating officer of Towson, Maryland-based Campbell. ‘‘When these anomalies in the market happen, in this case how highly correlated moves in many markets were, you are either on the right side or the wrong side. This time we were definitely on the wrong side’’ in currencies, interest rates and equities.
In currencies, Boca Raton, Florida-based Henry's largest loss in July was in the yen, Kenneth Webster, president and chief operating officer, said in a statement on its Web site. Assets at the firm, which is owned by John W. Henry, who also controls the Boston Red Sox baseball team, have plummeted by 75 percent since November to 9 million.
‘‘I don't think that the unwind of the carry trade is over by a long shot,’’ said Naomi Fink, senior currency strategist at BNP Paribas SA in New York. ‘‘The subprime issues remain.’’
For funds and large investors, these were multi million dollar moves so I guess the Danielcode levels were important. I am not aware that any other method of analysis called this dramatic turn to the tick (practically) and to the day.
Those in the Yen trade will be interested to see what the Danielcode levels did to the NZD-Yen cross.
NZD-JPY at its Danielcode target and called for a likely reversal in my 25 July 2007 ALERT!

17th August 2007. Made its turn just 35 ticks from its Danielcode target. Was this worth knowing??

How often do these levels define the currency markets? In the pre turn AUD-USD chart above dated July 2007, the next major Daniel number was shown as 93.41. The November turn came at 93.44!
The answer appears to be that the Danielcode defines all markets in all timeframes, but that's for another day.
While we are focusing on Pacific currencies, this is how USD-JPY responds to the Daniel numbers. Every swing turns within 50 ticks of the prescribed levels on either a high/low bar or close only basis. These levels are a mathematical matrix derived solely from the 2005 low. The only input is price.
USD-JPY

You can learn more about this unique number series at www.thedanielcode.com
There are currency reports, explanatory articles, letters to clients and PowerPoint presentations. For those with a cynical bent you can test the veracity of my claims or see how the knowledge of these levels in a timely manner could have benefited you. All charts and documents in this article and on my website were date stamped by an independent third party for verification.
I am now making the Danielcode sequence available to subscribers on selected currencies. A full service private client advisory is also available for corporates who require a comprehensive solution for their currency strategies.
I have studied this phenomenon day and night for over 10 years. As a cynical old Attorney, I have tried as hard to disprove the hypothesis as to understand. It has never failed.
© 2007 John Needham


