


Natural gas prices rose modestly through the beginning of the summer, but then faded along with the heat of July and early August. As it became clear that there would be no material adversity caused by hurricanes in the Gulf of Mexico, prices continued to fall. Drilling programs remained robust, in spite of prices in the $3.5-$5.5 range, which has added pressure to already weak fundamentals. It has been a difficult summer for natural gas bulls, as the optimism surrounding shale gas now appears to be justified.
Inventories
Because it was a warm summer, inventory levels fell significantly below 2009 levels during July and August, and remain so today on a year over year comparison. However, it is difficult to make a bullish case for natural gas based on current inventory reports or the summer’s reports. In fact, after backing out the effects of weather, I find a surplus of natural gas on the order of 1 billion cubic feet a day for both current readings and year to date average. Frequent readers of my column might recognize Figure 1, which shows supply and demand after backing out the effects of weather by using a regression on year over year comparisons in heating degree days and inventory changes. It shows that, at best, reports have been neutral over the past 6 months, and that for most of that period (including current readings) there have been bearish changes in inventories. This leaves natural gas in the awkward stance of being bearish (due to the underlying surplus) but not that bearish (due to the summer’s heat). Since the winter heating season is only 6 weeks away, and we are in no danger of running out of storage capacity, it is unlikely we will get a wash out in prices like we experienced in September 2009.
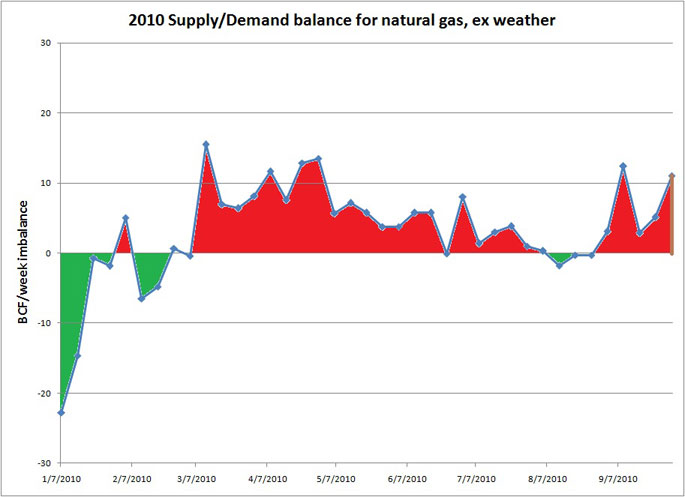
Figure 1: Supply and Demand balance: backing out the effects of heating and cooling degree days; most of the year the market has been oversupplied. Data: NOAA, EIA.
Production
Producers have become a victim of their own success. While each individual company may have responded with glee to their production and reserve numbers, the net effect has been a reenactment of tragedy of the commons. All of the optimism about shale gas has driven the price of natural gas down to barely profitable (or not profitable) levels. This in turn has forced companies to sell out (XTO) or sell off assets (here and here.) While opinions vary on whether these companies are getting fair value, it is safe to say that the term of the current deals would not have been made if it wasn’t for such low natural gas prices. However, with the collapse of the natural gas 12 month forward strip under .50, and with the contractual obligations to drill from 2008 lease agreements ending in 2011, I expect that rig counts will start to decline before long. Since the effect of contractual obligations will decline, the next 12 months of drill rates will give us a better picture of the true marginal cost of drilling in these fields.
Different Fields, Different Results
Early indications seem to be that the Marcellus shale has slower decline rates than the Haynesville, but more political risk. The lower decline rates are borne out by drill rates that show increases in Pennsylvania (Marcellus) and Oklahoma (Woodford) and decreases in Texas (Barnett, Eagle Ford) and Louisiana (Haynesville) since the beginning of the year (Figure 2.) It seems more and more likely that these shale fields are the “real deal” and that we have found a lucky stop gap for our nation’s energy needs. How long that stop gap lasts is a legitimate question, and there are still wildly varying estimates on what price point is necessary to make these fields profitable.

Figure 2: State by state analysis of rig counts. Rig count down in Texas, Louisiana (older shale), and up in Pennsylvania/Oklahoma (newer shale). Data: Smith International, Credit Suisse.
Where’s the Price Floor?
Comparing the price of the 12 month strip with the front month contract over the past couple of years, reveals that the price floor has been much more consistent (~.50) in the 12 month strip than in the front month contract. The 12 month strip price has recently fallen below this floor and is now trading around .20. While this may indicate that cost estimates have come down even further in shale fields, it may also just be a temporary drop below the cost of production. Indeed, an interesting divergence has occurred over the past week as the fall in the front month price has not been accompanied by a similar drop in the 2011 contracts.
Looking Forward
It seems likely that the current glut in inventories and excess supply will continue to provide a bearish ceiling for natural gas prices. On the other side, it seems as though .20 is acting as a decent floor for prices for the 12 month average. As we move through 2011, a careful eye should be kept on rig count. If rig counts stay high in spite of expiring leasing obligations, then it is a sign that marginal costs of production are on the lower side of current predictions.
Natural gas bulls have traveled a difficult road over the past 2-4 years, and signs of increased substitution use continue to emerge at only a trickle. News articles featuring new natural gas vehicles, fleets and infrastructure are few and far between. Infrastructure is the crux of the matter; if it attains a critical mass, we are likely to see a rapid acceleration in natural gas vehicle use. Were this to occur, it would provide a boon to the nation’s consumers and to our trade deficit as we could substitute cheaper domestic natural gas for expensive foreign oil! The evidence increasingly points toward sustained low prices for natural gas as long as shale gas is the marginal source of new gas supplies.
While increasing optimism about the potential for shale gas production is justified, there are still reasons for caution. One concern is that while the majority of new rigs are now drilling in shale gas, the majority of existing supply is still traditional gas. Because of shale’s astronomical decline rates, shale will need to replace not only the decline in traditional fields going forward, but also (increasingly) the decline in existing shale wells. A second concern is that the quality of results may decline as the “sweet spots” in shale areas are consumed. Finally, since much of the drilling in the past couple of years may be distorted by contractual obligation related to land leasing, we might not have a true picture of the costs for another 12-18 months. While $4.2 seems to be the floor for pricing at this stage, it would not be surprising if this price floor moved to the $5-$6 range in 12 months time.
Market Wrap
In other markets, gold and silver continue to cruise higher even though the associated precious metal equities seem not to be confirming the move. Not surprisingly, corn and soybean are showing tremendous strength after the bullish USDA report from last Friday. As a sector, commodities have been rallying along with inflation expectations as financial participants increasingly price in the possibility of QE2.
The views expressed are those of Matthew Millar and do not reflect the opinions or views of Armored Wolf.


