


The RecessionALERT Valuation Index (RAVI) is a multifactor valuation model that examines cyclically adjusted trailing SP-500 earnings (various multi-decade horizons), the SP-500 total-return index level, total stock market capitalization, Gross Domestic Product, non-financial corporate equities and liabilities, non-financial ;corporate business net-worth and percentage of investors’ allocation to stocks versus cash and bonds to determine 10, 5, 3, 2 and 1 year forecasts for the SP-500 Total Return Index (dividends re-invested). The in-sample accuracy of the various forecast horizons since 1970 are shown below (click any image to enlarge):

The RAVI model is updated quarterly and lags by one quarter. The data for the 3rd quarter of 2014 (as at end of September) was released on 17 December 2014. Let us examine what it is telling us about ^SPXTR (SP500 Total Return Index) returns across the various forecast horizons:
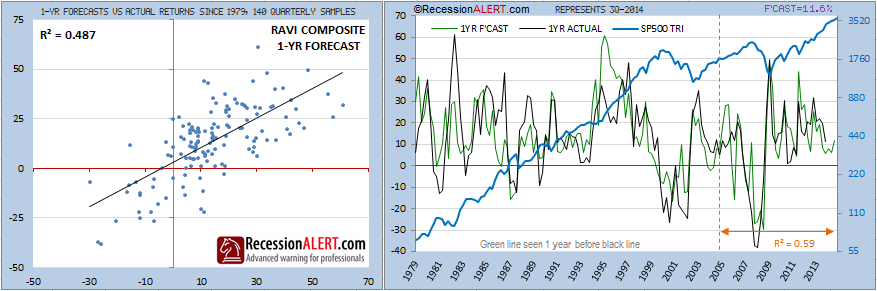
The 1-year (4 quarter) forecast appears below. The first chart on the left shows the accuracy of the RAVI model since 1979 with the x-axis representing the model forecast and the y-axis representing the actual achieved ^SPXTR 1-year returns from the forecast date. An r-squared of 0.487 might not appear much to sniff at, but considering the short forecast horizon, it is actually somewhat astonishing as far as forecasting models go. In fact, the r-squared correlation over the last 9 years since 2005 has actually tightened to 0.59. The model is forecasting returns of 11.6% from October 2014 through to October 2015. Given that ^SPXTR has already risen 6.4% since 1 October 2014, this leaves 4.89% gain potential for the next 10.5 months from 17 Dec 2014 or roughly 5.62% compound growth rate.
The 2-year (8 quarter) forecast appears below. The first chart on the left shows the accuracy of the RAVI model since 1978 with the x-axis representing the model forecast and the y-axis representing the actual achieved ^SPXTR 2-year returns from the forecast date. The longer horizon yields a much higher correlation as is to be expected. An r-squared of 0.69 might not appear much, but considering the short forecast horizon, it is actually respectable as far as forecasting models go. In fact, the r-squared correlation over the last 9 years since 2005 has actually tightened to a respectable 0.79. The model is forecasting returns of 24.5% from October 2014 through to October 2016 which equates to 11.6% compound growth per annum which dovetails nicely with the 1-year forecast. Given that ^SPXTR has already risen 6.4% since 1 October 2014, this leaves 17.01% gain potential for the next 22.5 months from 17 Dec 2014, or roughly 8.76% compound growth rate.

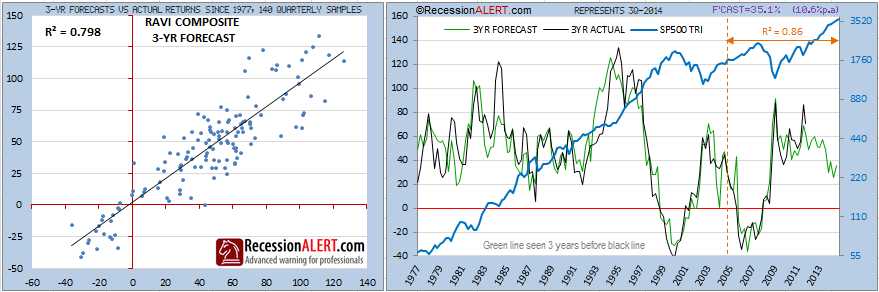
The 3-year (12 quarter) forecast appears below. The first chart on the left shows the accuracy of the RAVI model since 1977 with the x-axis representing the model forecast and the y-axis representing the actual achieved ^SPXTR 3-year returns from the forecast date. The longer horizon yields a much higher correlation as is to be expected. An r-squared of 0.79 is respectable considering the short forecast horizon, and the correlation has actually improved to 0.86 over the last 9 years since 2005. The model is forecasting returns of 35.1% from October 2014 through to October 2017 which equates to 10.6% compound growth per annum. Given that ^SPXTR has already risen 6.4% since 1 October 2014, this leaves 26.97% gain potential for the next 34.5 months from 17 Dec 2014, or roughly 8.66% compound growth rate – very close to the 2-year forecast:
The 5-year (20 quarter) forecast appears below. The first chart on the left shows the accuracy of the RAVI model since 1975 with the x-axis representing the model forecast and the y-axis representing the actual achieved ^SPXTR 5-year returns from the forecast date. The longer horizon yields a much higher correlation as is to be expected. An r-squared of 0.88 is pretty respectable considering the short forecast horizon, and the correlation has actually improved to an astonishing 0.96 over the last 9 years since 2005. The model is forecasting returns of 51.8% from October 2014 through to October 2019 which equates to 8.7% compound growth per annum. Given that ^SPXTR has already risen 6.4% since 1 October 2014, this leaves 42.7% gain potential for the next 58.5 months from 17 Dec 2014, or roughly 7.56% compound growth rate:

If we average the compound growth rate forecasts from the 2,3 and 5-year forecasting models, we get an expected annual growth rate of 8.33% for ^SPXTR. We can apply this growth rate to the next 12.5 months taking us to the end of 2015 to arrive at an estimate of 8.67% growth for the SP-500 or a target of 2,246 by the end of 2015 (assuming of course that the SP-500 grows at roughly the same rate as the ^SPXTR over the next year). This lines up in the middle of existing targets that have been thrown out in the blogosphere ranging from 2,100 to 2,350. Of course, as each quarter progresses we will get more refined/updated information to provide even higher accuracy targets for 2015.


