


Quick take: Based on the November S&P 500 average of daily closes, the Crestmont P/E is 122% above its arithmetic mean and at the 99th percentile of this fourteen-plus-decade monthly metric.
The 2011 article P/E: Future On The Horizon by Advisor Perspectives contributor Ed Easterling provided an overview of Ed's method for determining where the market is headed. His analysis was quite compelling. Accordingly, we include the Crestmont Research data to our monthly market valuation updates. See also his latest update: Understanding Secular Stock Market Cycles.
Listen to Louis Gave on Tech Stock Mania and the Greatest Threat to ‘Bull Market in Everything’
The first chart is the Crestmont equivalent of the Cyclical P/E10 ratio chart we've been sharing on a monthly basis for the past few years.
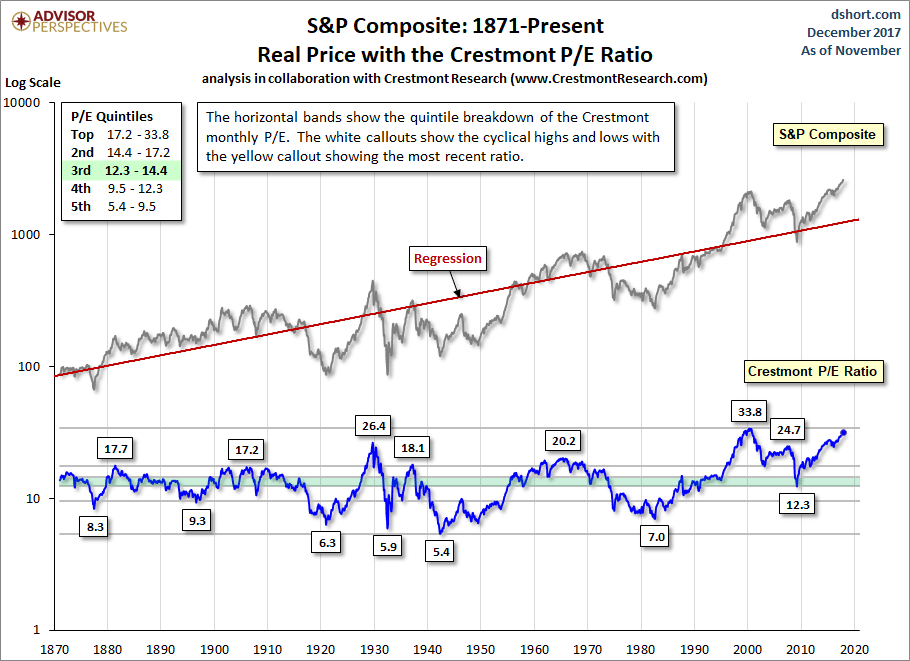
The Crestmont P/E of 31.4 is 122% above its average (arithmetic mean) and at the 99th percentile of this fourteen-plus-decade series. We've recently highlighted a couple more level-driven periods in this chart: the current rally, which started in early 2014, and the two months in 1929 with P/E above the 25 level. Note the current period is within the same neighborhood as both the tech bubble and the 1929 periods, all with P/E above 25.
Don't miss Are We in for Below-Average Returns Over the Next Decade?

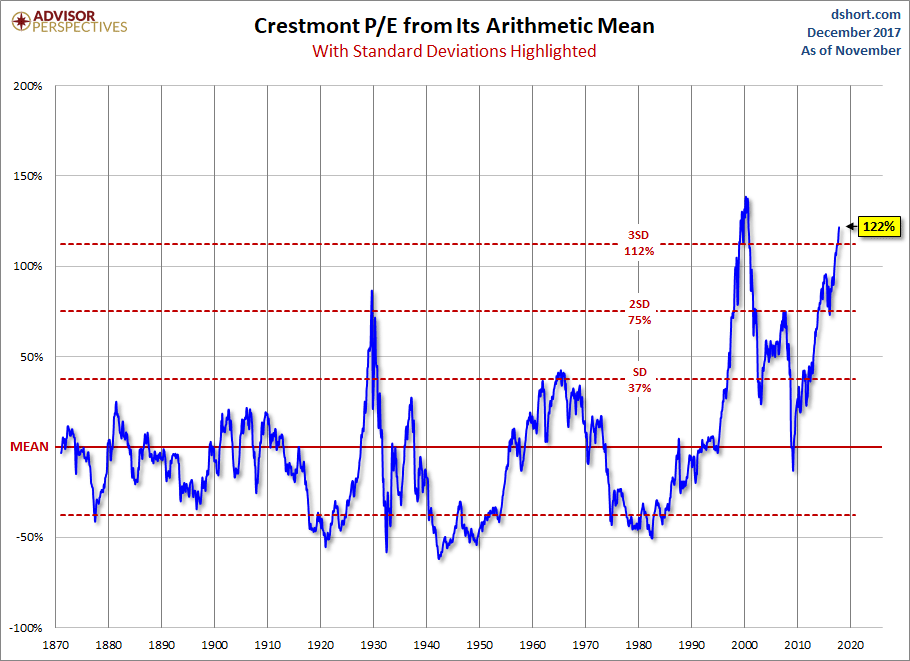
Crestmont Deviation From the Mean
Here is a pair of charts illustrating the historic Crestmont P/E ratio from its mean (average) and geometric mean with callouts for peaks and troughs along with the latest values.

Background on Ed Easterling's Crestmont P/E
For a better understanding of these charts, please see Ed's two-part commentary here:
Ed Easterling is the author of Probable Outcomes: Secular Stock Market Insights and award-winning Unexpected Returns: Understanding Secular Stock Market Cycles. He is currently President of an investment management and research firm. In addition, he previously served as an adjunct professor and taught the course on alternative investments and hedge funds for MBA students at SMU in Dallas, Texas. Mr. Easterling publishes provocative research and graphical analyses on the financial markets at www.CrestmontResearch.com.


