


In a new initiative, Financial Sense has asked contributors to furnish more frequent market commentary to map the rapidly changing market environments. To assist in this effort to bring timely and useful analysis and insights to readers, the Danielcode will wherever possible, provide a bi-weekly market commentary on major markets of interest to traders and investors. Of necessity, these market updates will be short and factual. As traders, our concern is with “what is” as well as “what will be”.
To blend these sometimes disparate views we morph across methodologies and across time scales. The “what is” factor is represented by the daily Danielcode trade signals issued daily across 16 forex pairs, 5 Equity indices and other important markets in Gold, Silver, Oil. T Bonds and selected grains.
The “what will be” factor is represented by a combination of time cycles and regression channel analysis. Once markets are trending, they stay in that trend much longer than you can imagine. So for those who wish to see the future, the most reliable method is to consider that once established, the trend remains until it ends. Trite but true. It’s also more reliable than any other method of forecasting. By combining these methodologies we can often find key turning points as we did with the March 2009 low in S&P; and we can keep longer term investors on the right side of the trade with our 6 and 12 day Long Term Trend Charts, all of which have been written about and discussed on Financial Sense previously. You can access my archives at FSO or at https://www.thedanielcode.com/ to flesh out the techniques that will be used in these regular updates.
To produce a bi-weekly market update for you, it needs perforce to be brief and factual. For those old enough to remember the epic “Dragnet” these updates will be “Just the facts Ma’am”
S&P
The S&P index has continued almost without interruption from its March 2009 low. The 6 day DC chart has returned just 1 confirmed Sell signal in that time, which arose from a DC 59 time cycle. Another is upon us now, but this chart remains on its Buy signal:

On the macro view, the daily chart rolled over on 04/26 from a very overbought position. On the daily chart below, S&P is just correcting a minor swing. Much more downside action will be required to change the 6 day chart’s bullish bias. Interestingly, there has been a marked divergence within the various Equities indices with DJIA and QQQQ holding their daily Buy trend, whilst Germany’s DAX and S&P have been issuing conditional Sell signals since mid April.

DX
The US Dollar index remains on its Buy signal on the 6 day chart. We have maintained a bullish posture on this market for this time frame since the week after the November 2009 low. If you would like to see how this call progressed in real time, the Danielcode regression charts are published usually every Friday and past charts and directional commentary are available under the “Trading Reports” tab at the DC website.
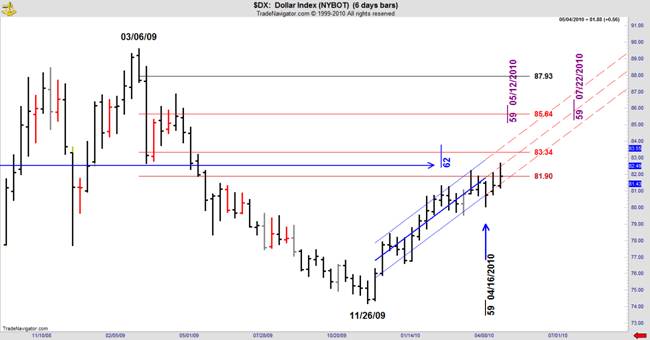
DX continues to present trading opportunities on the Daily chart. Making a top just 4 ticks from its Danielcode Blue line target at 82.83 last Wednesday, we have had both a daily sell and buy signal as DX corrects a minor range. Nothing here to get excited about so far.

US T Bonds
The big news in this week’s trading comes in the 30 year US T Bond. The 6 day trend chart issued a Buy signal as it broke above its regression channel last week. The low at 114^06 on 04/09 was just 6 ticks from the DC Blue line target. The 12 day chart remains on its Sell signal and we watch to see if the trend change now morphs into the longer term charts.
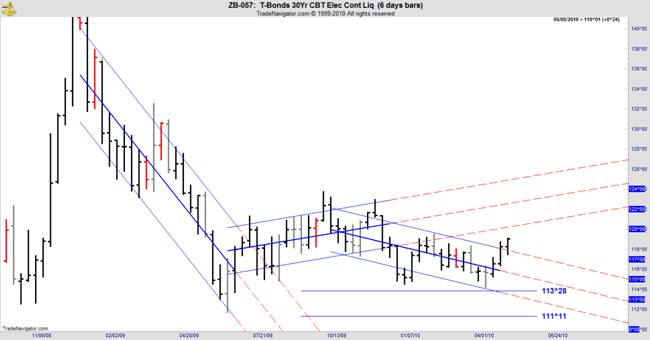
On the daily chart. T Bonds found the DC Blue line target at 119^01 on Friday’s close after an almost month long rally that started in response to the T.03 Buy signal made 04/07.

On Friday, we’ll look at Gold, DAX and inevitably the S&P. Just choose your time frame and track the charts that are most useful to you. Remember that despite views, opinions, conspiracy theories and other entertainments, the market pays only on price. And that’s the trend that impacts your trading or investment account.
The Danielcode regression analysis defines those trends.
Copyright © 2010 John Needham


