


Successfully predict the start of the next recession, plus or minus a few months, and you stand to make a lot of money. Not only can you reposition your portfolio towards bonds and cash – typically the best place to be during periods of economic malaise – but you can also sell your stocks at or near the market’s peak.
In fact, if your primary objective is to invest in sync with the primary trend of the market, then predicting the onset of a recession is your most important task. This is because the primary trend of the market typically follows the economic business cycle.
Read Markets Facing a "Time of Reckoning", Says OMFIF's David Marsh
The current expansion is one of the longest on record, which has led to many calls for its prompt demise. But as we all know, expansions don’t die of old age, they die of excess … typically triggered by some type of Minsky moment.
This is an important fact to understand because there is a very real difference between the length of an expansion and the rate at which excesses build. If excesses in the system build rapidly, our economic expansion can come to an end quickly. But if a recovery is slow and monotonous, tending to much more closely track the long-run growth rate of the economy, then it can last a long, long time.
The team over at J.P. Morgan has done an excellent job tracking the length and growth rates of recent economic expansions, and this information is summarized in the two charts below.

On the left, we can see that the current expansion is the second longest in history, lasting 107 months (through May 2018). It just recently surpassed the now third-longest expansion in history, which began in the 1960’s and lasted 106 months.
Now that this expansion has secured the silver medal, the question becomes whether or not it will make a run for gold. The longest expansion in history was the technology-fueled 1990’s boom, which lasted a full 10 years or 120 months. That means the current expansion must last at least another year to take the crown. Will we see that happen?
If you were to look only at the left chart above, you might be tempted to say no. In fact, you’d probably be inclined to begin paring back equity exposure to this market. After all, we’ve had quite a run, from a duration perspective – why bother pressing your luck?
But there’s a vastly different view of this expansion to explore and that has to do with cumulative real GDP growth. We can see this in the right chart above.
Read also Financial Sense Leading Economic Indicator Confirms Decelerating Growth Outlook
This chart shows how quickly the economy has grown during historical expansions, and as you can see, the current expansion (light blue) appears to be an outlier. Even though this expansion has lasted nearly nine full years, in terms of real GDP growth, we haven’t even matched many of the prior shorter expansions.
Now, real GDP growth is not a perfect proxy for the amount of “excesses” building in the system, but it does tell us that there’s something uniquely different about this expansion. As such, we shouldn’t be too surprised if other characteristics, such as length, differ as well.
Here’s something else to consider. According to the Minneapolis Fed, the current expansion has seen GDP rise by a total of 21% from the end of the last recession in June 2009.

If we assume a nine-year expansion to make the math easy, then we end up with an arithmetic average growth rate of 2.33% per year during this expansion.
Of course, the math geeks out there will quickly point out that an arithmetic average doesn’t take into account the effects of compounding, and consequently will overstate the growth rate. So we can also calculate a compound annual growth rate (CAGR) which works out to 2.1% over the nine-year period.
Now ask yourself this: What is the long-term growth rate of the economy? 2%? 3%? 1%? No offense, but you’re probably not that great at predicting economic growth rates, so let’s check in with some other sources.
The chart below shows the Federal Reserve’s collective estimate of long-term real GDP growth, and as you can see, over the last few years the projected long-term growth rate of the economy has fallen to just below 2%.

I realize that many of you don’t trust anything the Fed says or does as a matter of principle, so let’s get some additional opinions. Last summer the Congressional Budget Office (CBO) estimated that potential GDP growth would average 1.8% over the ensuing decade. As for private sector economists, those recently surveyed by the Wall Street Journal put that figure at 2.2% per year.
So we’ve got 1.9% from the Fed, 1.8% from the CBO and 2.2% from private sector economists … let’s average them and call the expected long-run growth rate of the economy 2%.
If that really is the case (no one knows for sure because GDP growth is a function of labor force growth and productivity growth – with the latter being very difficult to forecast) then think about the possible implications for this economic expansion.
If the long-run growth rate in our economy is currently 2%, and we’ve been growing at a rate of 2.1% for the last nine years, then we’ve basically matched the long-run growth rate of the economy. If that’s the case, then we really aren’t seeing the type of economic overshoot that is usually followed by a severe recession.
Recessions happen because our economy experiences a boom, which takes it too far above the long-run growth rate – a situation that is not sustainable. The recession, or economic contraction, is the period during which the economy falls back to this long-term growth line. But here’s the kicker: If there is no boom, there’s no recession …
The ultimate goal of a “managed” economy is to maintain slow and sustainable growth over time. Our history of booms and busts has shown that we’ve been exceptionally bad at this, but is it possible that by luck or accident we’ve actually accomplished it over the last nine years?
Even if we have, this does not guarantee that we won’t see a recession in the next couple of years, but it certainly makes interesting food for thought. And if we do have a recession, perhaps it’ll be more benign than in previous cases.
Those who have followed my work over the years know that I spend a good deal of time monitoring so-called leading indicators. These are economic data sets that tend to roll over in advance of approaching recessions. Without getting into the details (we’ll save that for a subsequent article) I think it’s safe to say that aside from a flattening yield curve, almost none of these leading economic indicators are flashing warning signs.
That doesn’t mean that asset prices are immune from further declines, but it does suggest that the risks of a major bear market remain low, at least for the next six months or so.
As for when the next recession may hit, the following chart shows survey results done by the WSJ, but I wouldn’t pay much attention to it.
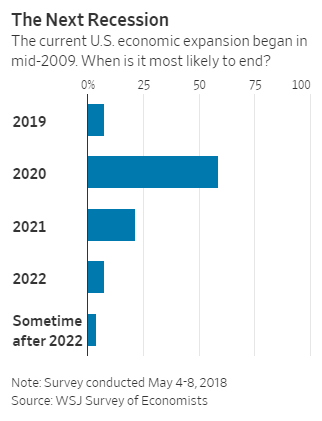
Trying to forecast ANYTHING further than a year or so out is a fool’s errand, as we live in a very dynamic and chaotic environment. The better bet is simply to remain open-minded and diligently watch for the telltale signs that will accompany the next inflection point.
The preceding content was an excerpt from Dow Theory Letters. To receive their daily updates and research, click here to subscribe. Matt is also the Chief Investment Strategist at Model Investing. For more information about algorithmic based portfolio management, click here.


