


That phrase doesn’t exactly describe the procession of events over the weekend at the G-7 meeting, but I think it’s a fair assessment of the state of the US economy. Let’s take a look at some longer-term trends in economic data after we take inventory of the litany of events ahead of us this week.
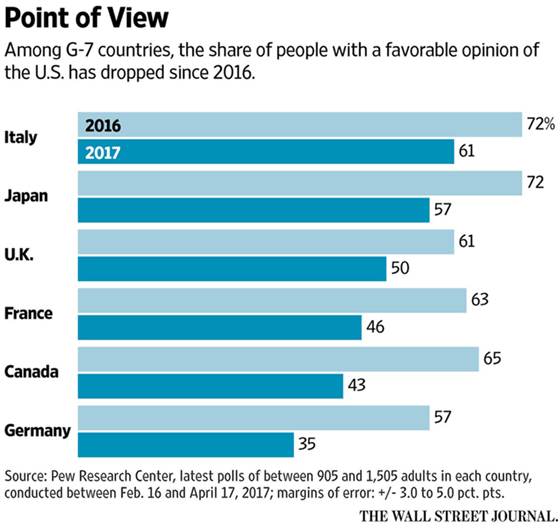
But first, I found the chart below from the WSJ rather interesting. As you’ve no doubt heard, President Trump caused a bit of a stir at the G-7 meeting by not signing a joint communique and getting into another spat with Canadian Prime Minister Justin Trudeau.
The harsh negotiating tactics and odd behavior have resulted in a diminished view of the US, which isn’t great from a “let’s all get along” standpoint but also isn’t necessarily the worst from a deal-making perspective.
Whenever two parties want something from each other, there is always a bit of disagreement and some minor hostilities. Think about the typical relationship between employer and employee, or parent and child – both represent situations where the parties must work together, even though they often have competing objectives.
Some tension is natural, so I wouldn’t read much into the above figures at all. If you think about it, the last thing you want in a negotiation is to have your counterparty walk away from the table smiling and thinking that you’re wonderful … chances are you gave them a better deal than necessary.
Moving on, this week on Tuesday we have the long-awaited meeting with North Korea, and who knows how that will go … Then the latest FOMC decision on rates is due out Wednesday.
Based on fed funds futures data, there is currently a 91.3% chance of a quarter-point rate hike stemming from this latest meeting. That would take the federal funds rate to a range of 1.75 – 2.0%.

A rate hike on Wednesday will yet again act to tighten financial conditions and flatten the yield curve. We’re sure to hear much commentary about the yield-curve, but remember this: historical data suggests that a flat yield curve does not mean the economy is doomed for recession, only an inverted yield curve does. It may sound like we’re splitting hairs, but that’s truly what the data shows.
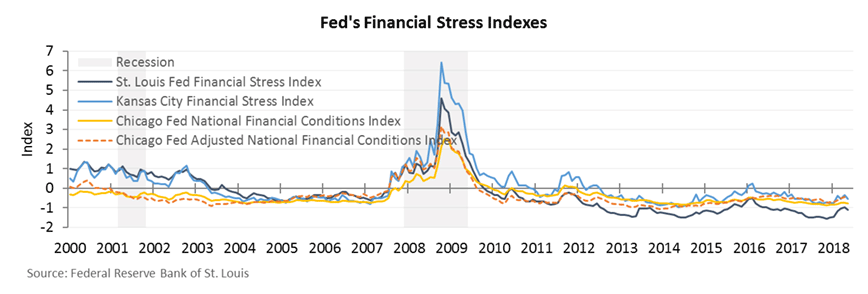
It’s also worth pointing out that even though financial conditions are becoming more onerous (the cost of money is rising), financial stress across the system remains subdued.
In addition to the Fed, the European Central Bank (ECB) and Bank of Japan (BOJ) are also holding meetings this week. So we could be in for a nice fireworks show.
With all these potential landmines laying around, one might be tempted to think the market should sell off. Well, if you haven’t noticed by now, the market usually doesn’t do what most people expect. As the proverbial saying goes, it’s always climbing a wall of worry.
But in order to climb that wall, the wall must be sitting on a somewhat sturdy foundation. In this case, that foundation is built out of corporate profits and hunky dory economic data. Let’s walk through some of the primary data points so you can see what I mean.
First, here’s a quick look at consumer spending, which drives the majority of US GDP. Consumer spending is up 4.7% year-over-year, and that growth rate seems to be holding steady.

Even though consumer spending is responsible for roughly two-thirds of our domestic output, as you can see in the chart above, a slowdown here is not what typically leads us into recession. For that, we need to look at business spending.
Also known as a gross private domestic investment, a decline in business spending is often one of the telltale signs that a recession is approaching. In the chart below, notice that business spending was contracting prior to the last two recessions (vertical gray shaded bars).

But over the past year and a half, business spending has actually been accelerating; it was up 5.8% year-over-year through the first quarter. This is a good sign and suggests that business leaders feel comfortable enough about the current economic environment to invest in future growth.
I don’t want to overload you with data but here are a few other important elements of the puzzle.
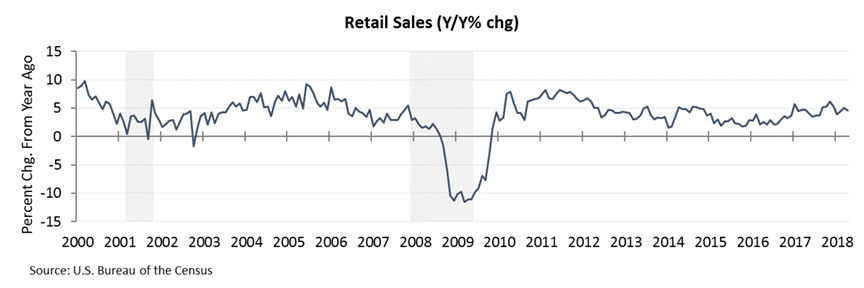
Retail sales are holding up fine, up 4.6% year-over-year.
Industrial production continues to accelerate, up 3.5% year-over-year.

And durable goods orders remain strong. Notice below how we saw a slowdown in durable goods orders prior to the last two recessions … We’ve yet to see that in the latest data, but this remains an area we should keep under close observation.

Leading indicators are also suggesting that the economic foundation remains strong. Jobless claims remain at historic lows and the ratio of unemployed workers to job openings has fallen to 0.95 – the lowest level since 1970. This means that there is currently more than one job available for each unemployed person (at least based on the Bureau of Labor Statistics’ definition of “unemployed”).
In addition, about 80% of our economy is powered by the service sector, and the ISM’s services PMI is holding firm in the 55%-60% range. This represents solid expansion, and therefore a low risk of recession.

The manufacturing sector of our economy continues to expand as well – its PMI came in at 58.7% last week for May, up 1.4% from the month prior.
Finally, consumer confidence remains strong, and by strong, I mean still near an 18-year high.

So as you can see, we’ve got a lot of things to be worried about, but economic fundamentals remain hunky dory. I believe this is part of the reason why we’re not seeing a more violent reaction to all the potential landmines that remain in front of us.
When I speak with investors, I often compare our economy to a freight train. It takes a long time to get it moving in one direction, and it takes a long time to bring it to a halt and get it moving backward. Our economy works the same way. It doesn’t stop and changes direction on a dime, it does so through a long and drawn out process.
So far, based on the economic momentum that we’re seeing, it’s probably fair to say that we’ll see slow and sustainable growth for at least the next few months. That should translate into a reasonably amicable environment for equities.
Just don’t forget that we are late cycle … this train’s been moving one way for a long time, and we know that eventually, it will reverse course.
The preceding content was an excerpt from Dow Theory Letters. To receive their daily updates and research, click here to subscribe. Matt is also the Chief Investment Strategist at Model Investing. For more information about algorithmic based portfolio management, click here.


