


When the cost of money changes, everything changes. Interest rates affect every aspect of the financial universe.
At the global level, they impact currency and trade flows between nations. At the national level, they affect the discounted value of future cash flows, the market’s multiple, and the desirability of items such as real estate and debt. And at the micro level, they impact the financing and investment decisions of all individuals and small businesses.
Interview Shifting Landscapes
That’s why it’s important to understand whether the bump in rates that we’ve seen recently is indicative of a new, secular trend, or merely a correction in the bond bull market that has lasted over three decades.
Let’s begin with the chart below, which shows the yield on the 10-year Treasury note over the past 50 years. Notice that after the major spike during the early 1980’s, interest rates settled into a long-term secular downward trend.

The trendlines that create this downward sloping channel are rare in the degree of precision they exhibit. Notice that the top trendline marked a short-term cyclical peak in interest rates on six separate occasions, and it has not been breached even once during the last three decades.
As big believers in technical analysis, and the power of the primary trend, it’s difficult to contest this price action. Using prices as our guide (or in this case, rates derived from prices) the primary trend of long-term interest rates is still down.
But let’s be realistic here.
If we were to continue the channel that has defined our bellwether interest rate further to the right, we’d find that eventually the entire channel would be in negative-rate territory.
Don't miss Martin Armstrong: Stock Market Bubble Still to Come
So unless the US economy tanks and investors decide they want to pay the US government to hold their money for long periods of time, this channel will be broken … it’s just a matter of when.
Right now, a move above roughly 2.7% would constitute a break of the long-term secular trend in interest rates. We were close to that level, at 2.6%, just one month ago.
Therefore, while a firm secular downward trend in interest rates currently exists, we are likely to see that dynamic change this year. Bear in mind, however, that this does not necessarily imply an upward trend is beginning.
For all we know, we could simply enter into a range-bound pattern as shown below.

Rates have been inside this range (approximately 1.5 – 3.0%) for over five years now. Could this be an indicator of “secular stagnation,” as proposed by Larry Summers, and/or the “new normal” put forth by Bill Gross?
It’s very possible.
One interesting observation previously set forth here is the disappearance of risk premium in the Treasury markets. We can see this in the chart below, which shows the 10-year Treasury yield in blue and the Consumer Price Index (CPI) in red.
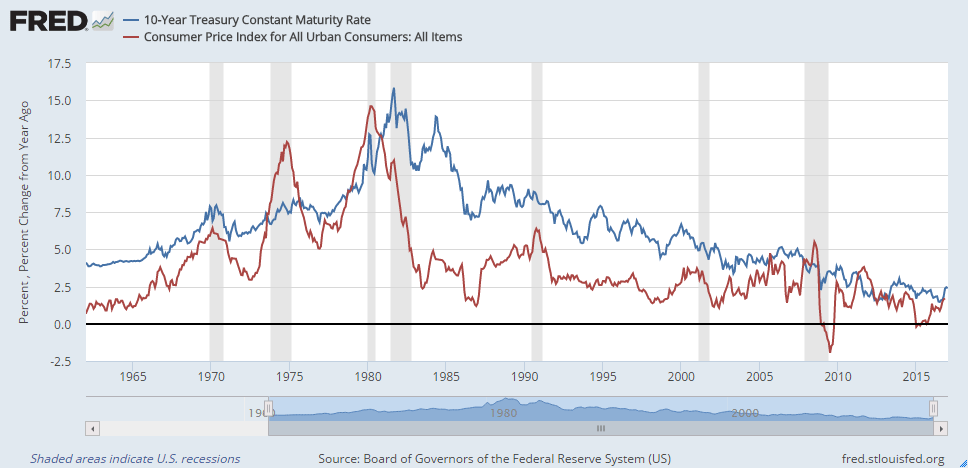
The CPI shows how fast purchasing power is being eroded, while the 10-year yield shows how much compensation bond owners receive.
The convergence of these two lines over the past three decades suggests that bond owners these days are receiving little more than compensation for lost purchasing power. That is, their reward for bearing risk has all but evaporated.
This is important for two reasons. The first is because fixed income investors need to understand that right now bonds are doing very little to “get them ahead.” While you might have more money in 10 years’ time, your purchasing power will not have improved very much, if at all.
The other reason this is important has to do with predicting where interest rates will head. While predicting interest rates used to be a function of two variables (expected inflation and risk premium), it’s now mostly a function of one: expected inflation.
That makes our jobs easier, at least it would seem. But as we all know, predicting the direction of even just one economic variable can be incredibly difficult. Especially when you consider how a strong move in other related variables (the dollar, for example) can derail any thesis we may have.
Lately, we’ve seen a variety of possible forces that may act to boost inflation, but we’ve also seen some moves (again, think the dollar) that have the possibility of keeping inflation at bay. Here’s a rundown of some of the forces in play:
Driving inflation higher:
- Proposed fiscal (deficit) spending
- Proposed tax cuts
- Proposed deregulation
- Improved economic outlook and consumer/business confidence
- Rebounding price of oil and other commodities
- Continued improvement in labor markets (more jobs)
Driving inflation lower:
- Strong dollar, which makes imports cheaper and exports more expensive
- Low inflation levels and general lack of growth around the rest of the world
- Expected rate hikes by the Federal Reserve
- Lack of productivity growth and productivity catalysts
- Demographic trends including lower population growth
These lists are by no means exhaustive, which should give you an idea of how difficult inflation is to predict. Making matters worse, there are numerous feedback loops and optionality effects that impact these variables.
But there is an interesting dynamic here and it relates to this: most of the catalysts that would drive inflation higher are still in the “proposed” state. In fact, nearly all factors supporting higher inflation, aside from rebounding commodity prices and continued labor market health, depend upon the incoming administration.
This makes sense, as prior to the Trump election the consensus was still that we were in a low growth, low inflation world. The dramatic shift since election day has seen a sharp rise in inflation expectations, which drove rates higher, but nearly all of this is speculation so far. It remains to be seen what changes will actually come to fruition.
And let’s not forget another fact: The Federal Reserve is committed to maintaining “price stability,” aka 2% inflation. While we know that the Fed is okay with inflation running a little hot (perhaps up to 2.5%), they will keep a lid on rising prices (devaluation of the dollar) if it gets out of hand.
Listen to Forecast 2017: The Oracles
That means that long-run inflation expectations should be anchored around 2 – 2.5% on the high end. If that’s the case, then considering the near-absence of risk premium, the yield on the 10-year Treasury should stay around 2.5 – 3.0%. This would keep us firmly inside the range outlined in the second chart of this article.
So have we and are we seeing a secular shift in interest rates? The answer is yes, but no. Our secular bull market in bonds may be coming to an end, but instead of a bear market, we may find ourselves in a secular range-bound or “cowardly lion” market for years to come.
The preceding content was an excerpt from Dow Theory Letters. To receive their daily updates and research, click here to subscribe.


