


Originally posted at Briefing.com
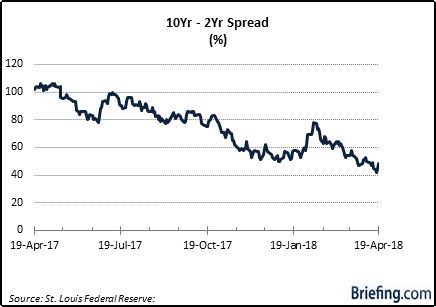
The spread between the 10-yr Treasury note and the 2-yr Treasury note dropped below 50 basis points on April 9 and it has remained below 50 basis points since then. It is currently at 49 basis points, up from 42 basis points on April 17, which was the tightest spread since September 2007.
You may also like Yamada: Dow Forming Bearish Technical Pattern
Converting an Inversion
This flattening action has raised anxiety in the market about a possible recession being on the horizon.
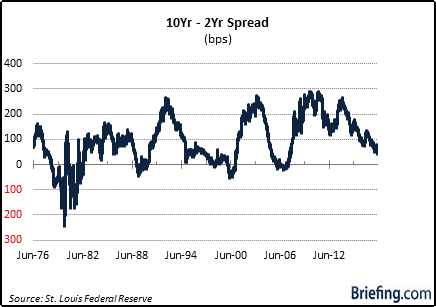
There have been past instances, like 1984, 1986, and 1995, when the spread dropped below 50 basis points but didn't invert before widening above 50 basis points again.
Why does this matter?
Because whenever the 10-2 spread has gone below 50 basis points, and subsequently inverted, there has been a recession every time dating back to 1980.
The Operative Word
These facts were confirmed in a dataset retrieved from FRED, Federal Reserve Bank of St. Louis [1], that stretches back to June 1976, and which was studied alongside the National Bureau of Economic Research's (NBER) business cycle dating history [2].
There have been five recessions since 1980, according to the NBER.
Per usual, those determinations were made in hindsight, yet they remain informative today given the connection between an inverted yield curve and an eventual recession.
The operative word is "eventual."
An inversion in the 10-2 spread isn't a coincident indicator. It is a leading indicator -- and the lead time can be significant. For example, the 10-2 spread inverted in December 2005, yet the Great Recession didn't begin until two years later.
The table below covers the five recession periods since 1980. It details the passage of time from when the 10-2 spread went below and stayed below 50 basis points, to when it inverted, and to when a recession ultimately started.
| Recession Period | Going below, and staying below, 50 bps | Inversion Date | Time to Recession |
|---|---|---|---|
| Jan. 1980 - July 1980 | 4/17/1978 | 8/18/1978 | 16 months |
| July 1981 - Nov. 1982 | 8/18/1980 | 9/12/1980 | 10 months |
| July 1990 - March 1991 | 9/26/1988 | 12/13/1988 | 19 months |
| March 2001 - Nov. 2001 | 3/20/1997 | 5/26/1998 | 22 months |
| Dec. 2007 - June 2009 | 5/19/2005 | 12/27/2005 | 24 months |
Source: NBER
What It All Means
In the five recessions since 1980, the time between the first inversion and the start of the eventual recession has averaged just over 18 months, with a range that spans ten months to two years.
The "R" word is apt to be heard more and more these days because of a flattening yield curve, but bear in mind that there has typically been a decent stretch of time before the recession the NBER dates in hindsight actually hits.
The market, however, won't wait on the NBER. It will react ahead of time if it smells a recession in the water.
To be sure, with history on its side since 1980, an inversion in the 10-2 spread is apt to be a malodorous sniff test for the market.


