


Source: bastardo122 on Reddit
The big question on my mind is whether this correction will be like the many we have faced or whether this correction is not like the others. The issue is that many of the fear indicators we’ve used in the past to pinpoint capitulation have been reached. Here’s a look at some of those indicators.
The VIX hit 50 and has currently dropped below 20.

Source: StockCharts (Past performance is no guarantee of future results)
The percentage of stocks above the 50-day moving average hit an oversold level below 30% and is back above that level, currently at 46%.

Source: StockCharts (Past performance is no guarantee of future results)
Credit default swaps (insurance against default) on junk and investment-grade corporate bonds have rolled over, which is also a good sign.
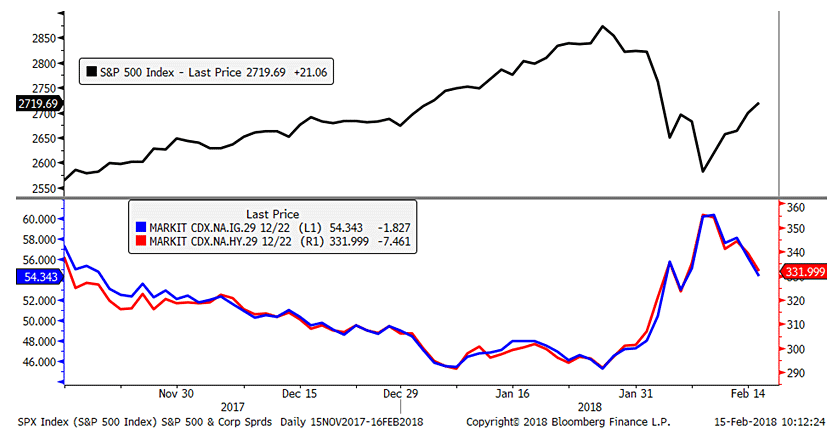
Source: Bloomberg (Past performance is no guarantee of future results)
Previous corrections have lasted far longer than just two weeks. They took place over 1-3 months in this bull market. Let’s review those corrections as it would behoove us to understand the nature of past corrections if we want to understand the present. It has of course been said by Mark Twain that history doesn’t repeat itself, but it often rhymes.
2010 “Flash Crash”
The Flash Crash of 2010 was caused by what the SEC and the Commodity Futures Trading Commission believe was an imbalance of orders caused by the use of spoofing algorithms that essentially communicated large orders being placed that were later canceled. Due to the speed at which programs can trade and feed on volatility, it exacerbated the situation into a more than 1000 point drop in the Dow. Suffice it to say there were a lot of fundamental problems occurring during the time, including the European Debt Crisis, but the crash was just one day in an ongoing 48-day correction in stocks.

Source: StockCharts (Past performance is no guarantee of future results)
2015 Chinese “Black Monday”
During August of 2015, there was a lot of concern that China’s economy was rolling over and money was leaving the country. The Chinese implemented capital controls and one of them was the devaluation of the yuan. On August 24th, the Dow fell 1000 points at the open but gained mainly half of it back in the first 50 minutes. Overall, the correction took place over the course of 28 days with a rally after the initial crash and a retest a month later.
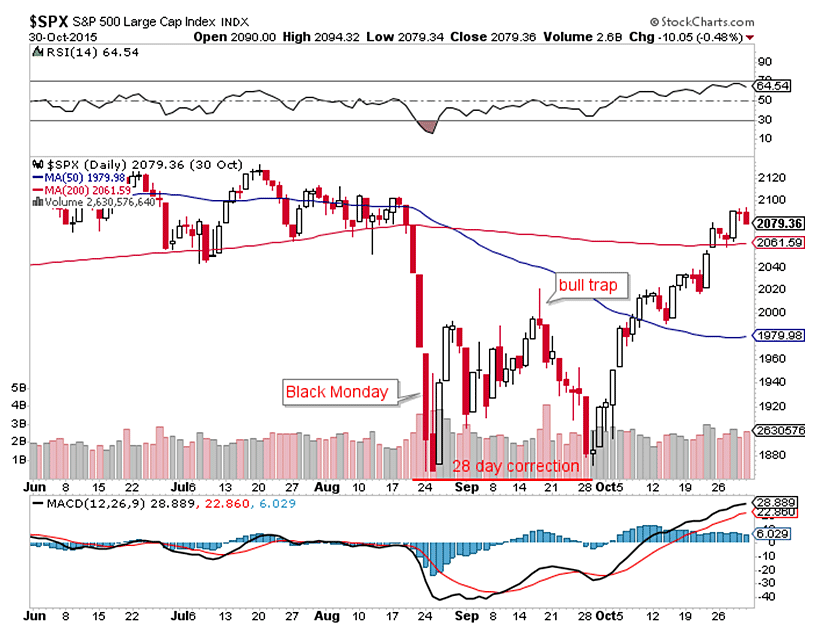
Source: StockCharts (Past performance is no guarantee of future results)
The 2016 Oil and Chinese Yuan Correction
Oil continued to plummet into the early portion of 2016. Oversupply plagued the markets based on OPEC’s strategy to push prices low enough to discourage US production. Meanwhile, the Chinese economy and flow of funds of out of the economy continued with more devaluation of the currency. At one point, the correction had fallen below the previous 2015 correction low, threatening the bull market with a potential top. We traded below that level for no more than a couple of days and quickly whipsawed back above support. In reviewing that correction, the market took 30 days to reach a bottom.

Source: StockCharts (Past performance is no guarantee of future results)
That brings us to today. Is the current bull market correction over or is there more to come? Is this correction not like the others? The S&P 500 closed above a key technical level, its 50-day moving average, at 2723. The convergence of the 50-day moving average, the 61.8% retracement of the correction, and the previous hourly high look like the logical area for the rally to struggle if the bears resurface. That said, we’ve already seen many indications that the momentum low is behind us. After a five-day rally, next week will be crucial.

Source: StockCharts (Past performance is no guarantee of future results)
Disclosures:
The information provided here is for general informational purposes only and should not be considered and individualized recommendation or personalized investment advice. The investment strategies mentioned here may not be suitable for everyone. Each investor needs to review and investment strategy for his or her own particular situation before making any investment decision.
All indexes are unmanaged and cannot be invested into directly.
For more information about Financial Sense® Wealth Management, our investment models, or investment services, click here to visit our website.


