


It is generally believed that euphoria is the terminal stage of aging bull markets. However, trying to estimate and gauge market sentiment like euphoria is easier said than done.
For the past few years, as the S&P 500 has melted higher, Wall Street analysts have been continually trying to guess the market top, with little success.
But is this about to change? Following a strong end to the year, the weekly AAII Investor Sentiment survey is showing that 52.6% of investors are currently bullish (meaning they feel markets will be positive over the next six months), that’s up from a September reading of 29.3% and above the historical average of 38.5%. Only 20.6% of investors describe themselves as bearish (down from 35.7%) and 26.7% of investors say they are neutral on the market. That’s above the historical average of 31%.
Check out Anatomy of a Bubble
Sentiment among private investors might have improved, but it seems that Wall Street analysts are still skeptical, if Bank of America’s Sell Side Indicator is anything to go by.
Sell Side Indicator Shows No Euphoria Yet
BoA's Sell Side Indicator is the average recommended equity allocation of Wall Street strategists as of the last business day of each month. Historically, this measure has proven to be a reliable contrary indicator with the S&P 500 generally putting in a positive performance when the reading is below the “sell” threshold of 62.8.
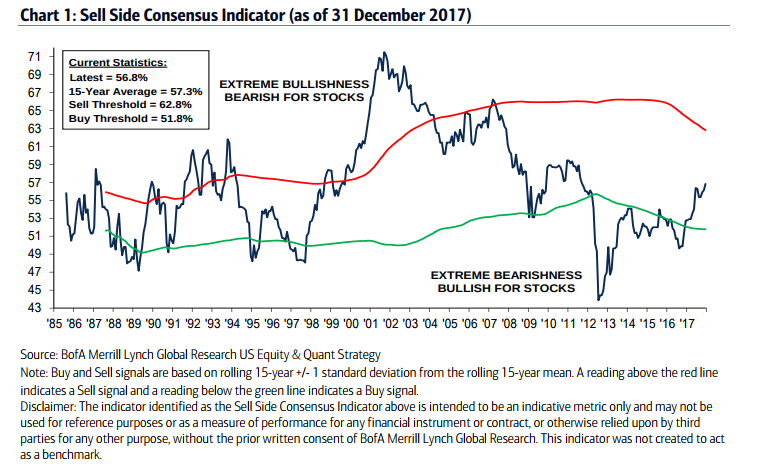
The Sell Side Indicator's latest reading is 56.8 from 56.1 in November, the third consecutive month of gains reflecting a rapid improvement in equity sentiment over the last 16 months. If the current rate of growth continues, BoA's analysts estimate that the indicator could hit the "sell" threshold by January 2019 and up to this point, the analysts are predicting double-digit gains.
Here's BoA's commentary on the latest reading:
"The S&P 500’s indicated dividend yield currently near 2% implies a 12-month price return of +10% and a 12-month value of 2935. Although this is not our S&P 500 target, is one of five signals we use to drive our market call, along with fundamental and technical signals. Historically, when our indicator has been this low or lower, total returns over the subsequent 12 months have been positive 93% of the time, with median 12-month returns of +19%. However, past performance is not an indication of future results."
By Rupert Hargreaves


