


Housing has historically been a leading economic bell weather that precedes peaks in the U.S. economic cycle. New data suggests housing may be rolling over. On Oct. 25 new home sales tumbled to the lowest level in two years according to the U.S. Consensus Bureau. In September’s report, U.S. home purchases fell more than estimated according to an article by Shobhana Chandra at Bloomberg Economics, adding to signs that a lack of affordability is crimping down on demand.

Apart from new home sales, existing home sales also showed clear signs of slowing. Last week, the National Association of Realtors reported that existing home sales fell in September to the weakest pace in nearly three years.
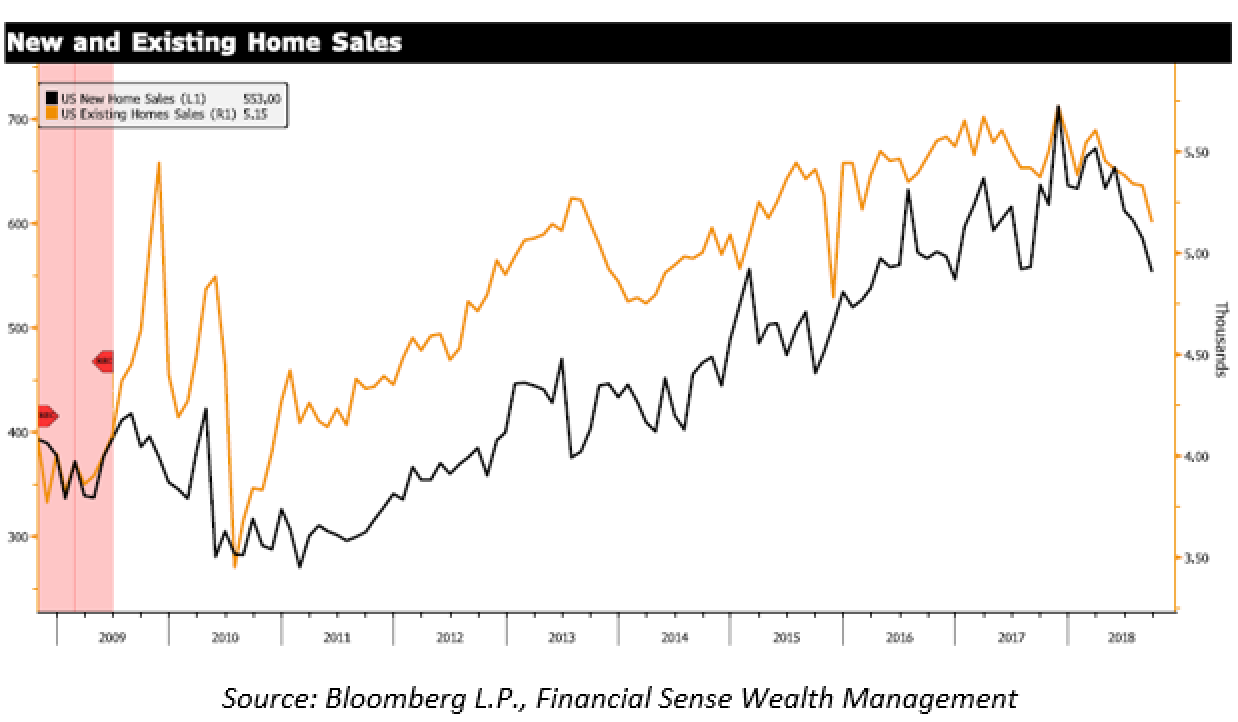
Sales fell in three of four regions and were not significantly influenced by the tropical hurricanes in the South, contrary to what analysts may have expected. In fact, sales were most affected in the most expensive regions of the states – the Northeast where existing home sales declined 40 percent mom and the Western region where existing home sales faltered 12 percent mom.
September’s months’ supply of homes rose to 7.1 from 6.5 months, extending it to the highest level since March 2011. Typically, anything more than six months is considered excess supply, as it can create deflationary pressure on home prices – something we are watching closely.

The latest data in housing supply continues to affirm our viewpoint that housing is weakening and that the last few months of declining home sales is not something that should be ignored.
Which came first: The chicken or the egg?
The demand problem or the supply problem? The recent up-tick in months’ supply of new and existing homes seems to be a direct result of declining home sales – suggesting the weakness in housing is demand-driven.
Declining home sales are typically a trend we see in the later stages of the business cycle. In the current cycle, rising interest rates, lagging wage growth and expensive home prices seem to be putting significant pressure on home buyers.
Third Quarter GDP Higher Than Expected, Capital Investment Slowing
Last Friday’s third quarter GDP report surprised modestly to the upside coming in at 3.5 percent, beating estimates of 3.3 percent. GDP growth eased from 3.5 percent in the third quarter from 4.2 percent in the second quarter. Even though we had a stronger headline number, not everything seemed rosy.
One surprise from last Friday’s GDP report: consumer spending. With wage growth still somewhat stagnant, consumer spending not only beat estimates (coming in at 3.7 percent) but accelerated at 4.0 percent - the fastest rate since late 2015 according to Katia Dmitrieva’s recent Bloomberg article.
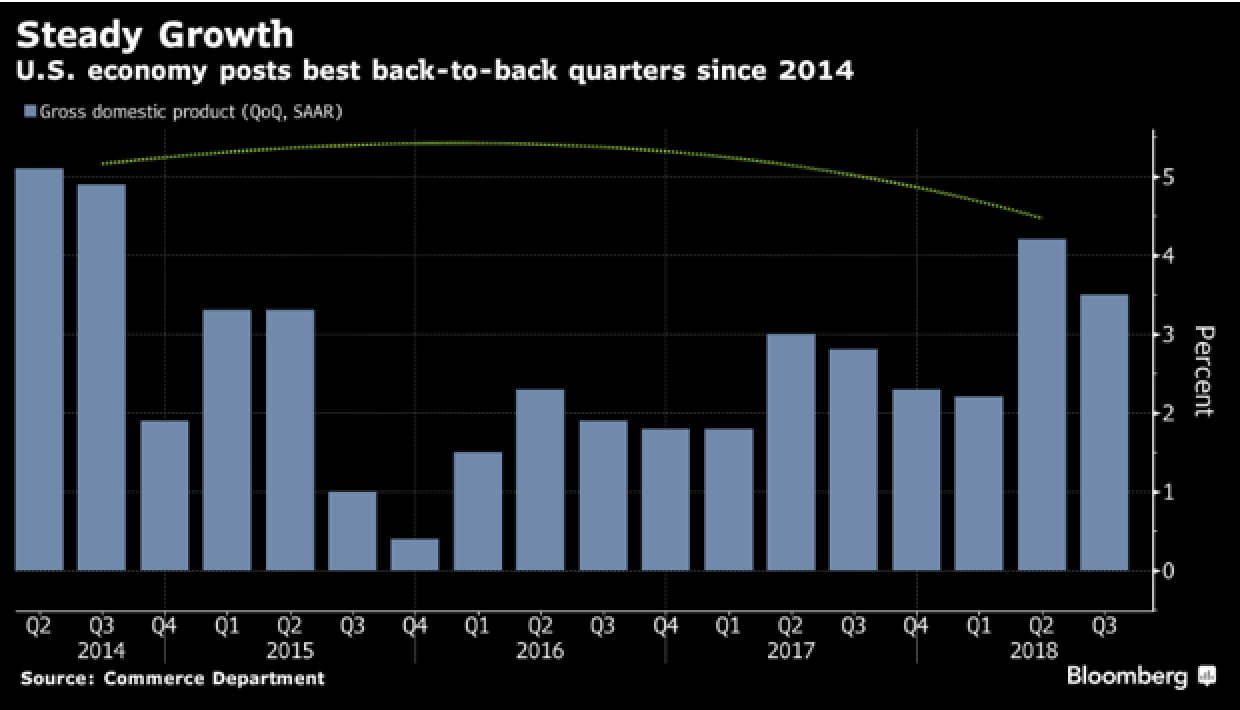
Business investment significantly decelerated this quarter, rising 0.8 percent vs. 8.7 percent in the second quarter showing signs that the Tax Cuts and Jobs Act might not have as much of a meaningful impact on growth/capital investment as hoped. Equipment investment and structure investments declined the most in the third quarter GDP report.
Net exports and inventories were also a significant note in this quarter’s GDP release – just not a positive one. Dave Rosenberg from Breakfast With Dave said, “Net inventories came in at the HIGHEST level since Q1 of 2015 and net exports coming in at the LOWEST since Q2 of 1985. These gyrations in larger inventories and exports are related to supply-chain strains stemming from tariffs”
The latest third quarter GDP report is expected to have important implications on the Fed policy this year and heading into next year. An hour after the GDP report was released Friday, market-implied probability of the Fed raising rates in December rose from 67 percent to 75 percent on Friday according to Bloomberg.
Dollar Continues Its Squeeze on INTL and EM
Recent strength in the dollar puts a lot of pressure on much of the S&P 500 where roughly 40 percent of the S&P’s revenue stream derives from activity overseas.

Abroad, the dollar has put extensive pressure on global markets, and as Rosenberg said, just “four of the 47 countries that make up the MSCI All Country World Index [are] trading above their 200-day moving average” – the pain in international and emerging markets starting to be felt.


