


The global market in securities has shown us over the past month just how volatile and risky investing can be. The catalysts and drivers behind the selling pressure are hard to pick out because it’s been fluid these past few weeks. Besides the price action, concerns stem from a few places:
- Growth slowing in Europe and Asia.
- U.S. may be seeing the beginning stages of a slowdown in housing, autos and earnings.
- The Federal Reserve Central Bank may be making a policy mistake in its glide path to raise rates in 2019.
Stocks have been falling in China and Europe since the February correction, but investors in U.S. equities largely believed that earnings growth would allow the U.S. to sidestep a global slowdown. This time was different – for a short while. Even Financial Sense Wealth Management was beginning to doubt our resolve that the U.S. would recouple. Recouple it has. On the surface, the technical damage is overdone and oversold. We are due a bounce. However, below the surface, the technical damage is severe enough to justify a conversation about a bear market.
Before going into a technical review of the markets, let’s talk first about those three bullet points above. Europe has been slowing for some time. The Flash Eurozone PMI Composite Output Index printed 52.7 so far this month. A reading above 50 means the survey points toward growth, but this recent survey was a 25-month low according to the report from IHS Markit. Without spending a whole lot of time dissecting the report, the chief economist at IHS, Chris Williamson, said “The survey is indicative of GDP growth waning to 0.3 percent in the fourth quarter, and forward-looking indicators, such as measures of future expectations and new business inflows, suggest further momentum could be lost in coming months...led by a drop in exports.”
China Slowing
China has been slowing since 2011 but continues to grow at a healthy clip with GDP recently posting 6.5 percent growth in the third quarter. This was down from the second quarter 6.7 percent print. The monthly Caixin China Composite PMI came in at 52.1 in September, a slight bump up from August, but data inside showed that output growth is unlikely to pick up in the months ahead. New orders and new export orders have rolled over (see below - click any image to enlarge).

China’s Shanghai Stock Composite Index has been in a free fall since Trump began talking about tariffs, but if you review that chart above it makes sense that stocks have been following export orders in the same direction – down.

China eased central bank policy with a drop in reserve requirements, a tax cut on personal income and assurances the PBOC will shore up financing for companies – making good on that promise with a plan to give CNY 10Bn to China Bond Insurance Co. announced last week. It is likely there will be more easing from China to come.
What About Earnings?
In the U.S. there are concerns that we’ve seen peak earnings and a peak in some economic data such as housing and auto sales. Starting off with earnings, we are looking at blended growth (estimates adjusted with actual results) in the third quarter of 22.5 percent earnings growth.
According to Factset last week, we’ve had one of the worst responses to positive earnings announcements since second quarter 2011. During the two-day window before and after earnings were announced, the average performance for 48 percent of the S&P 500 companies that had reported positive surprises by last Friday was a return of -1.5 percent, well under the five-year average gain of one percent during that same 4-day window.
Companies reporting negative surprises were also punished more severely, down 3.8 percent versus the five-year average of only falling 2.5 percent to negative surprises within the four-day window. Investors may be thinking this is as good as it will get – that we’ve seen peak earnings growth – and are punishing companies accordingly. Bloomberg reports the consensus view earnings will grow in the single digits next year at only 9.69 percent as of today.

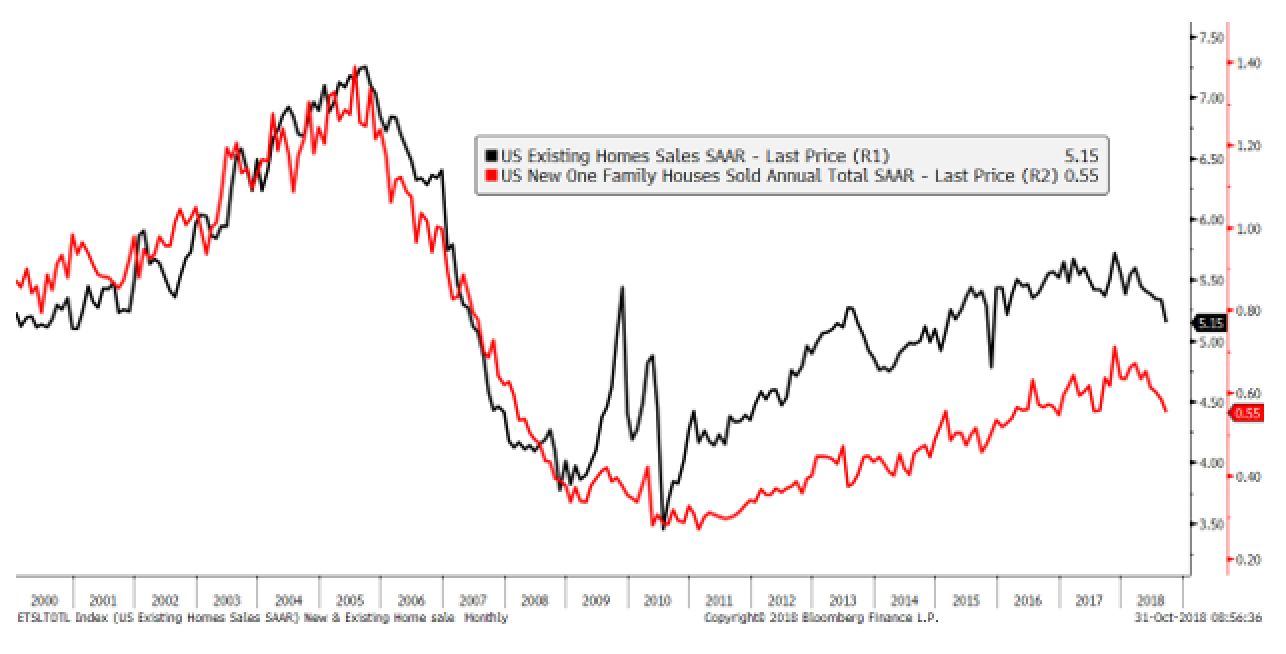
In housing, you simply can’t make negative changes to mortgage tax deductions and continue to raise rates without some kind of response in sales. Viewing the chart below it appears that housing sales have peaked for this cycle.
The Fed continues planning to raise rates despite a market view from the Fed Futures that does not agree with the outlook. This is yet another factor that caused risk assets to adjust down in October.
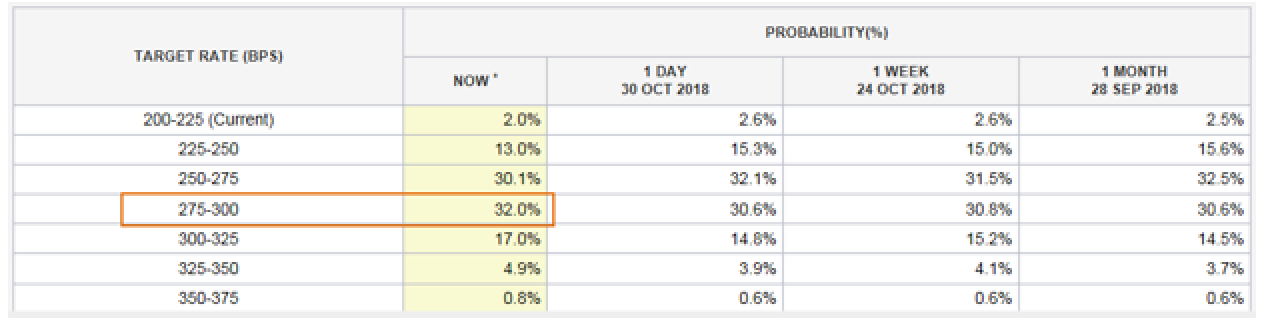
Below, the Fed Futures are pricing in a 32 percent chance of three quarter-point hikes by December 2019 from today. With current estimates, the Fed will hike this December - that’s only factoring in two hikes for the entirety of 2019. This has been and continues to be a large gap between the market and the Fed’s outlooks. Not to mention, we’ve also heard Powell say since the September meeting that the neutral rate may be higher than current views.
The next Fed meeting is Nov. 7-8. Nobody expects a rate hike, but the public will be paying attention due to recent volatility to see if the tone has changed. I’m not holding my breath as Fed speakers last week like Richard Clardia and Loretta Mester both downplayed the market drop.
Consumer Survey has several components. Many help lead with data that points toward weakness or recovery ahead of the hard data because it’s based on consumer expectations - one of which is housing with the buying conditions survey.

Richard Curtin, a director of the University of Michigan’s Survey Research Center wrote an interesting article about buying and selling conditions in housing this month you can read here. He said,
“The data suggest that the primary factor related to sluggish home sales in the current expansion has been due to the divergences between consumer perceptions of credit conditions and their evaluations of home prices. Shifting from slowly sinking home sales to a quicker descent is likely to involve declines in home prices as mortgage rates increase…Current forecasts of a slow decline in home sales ignore the associated impact on home selling conditions and the importance of loss aversion…”
In summary, we’ll have a weaker housing market if sellers begin putting homes on the market in earnest, say if their property stopped rising in value and began to decline. Curtin also said during the third quarter this year, homeowners only anticipate an annual growth of 2.7 percent in the value of their home over the next five years. That’s not a whole lot of room left for housing prices to rise this cycle. We could be very close to a housing top over the next year.
Auto sales are another leading indicator for recessions based on historical records. One relationship that tends to lead auto sales is the question within the University of Michigan Consumer Survey, “is it a good time to buy a vehicle?”
This question tends to lead auto sales by about nine months. Though it is hard to tell if auto sales have peaked, the good time to buy question within the consumer survey is pointing towards further weakness in the near future.

Housing and auto sales have signaled these areas are weakening and have possibly peaked for this cycle. These aren’t the only industries and components to the economy as jobs data still suggests the economy is healthy and inflation has remained low. Though they have signaled economic peaks in the past and should not be brushed off.
Up until now, I’ve been writing about what’s below the surface behind this market correction which could be considered chinks in the armor of the U.S. business cycle. I’d like to turn now toward the technical developments as of late which is more of what’s ‘on the surface’.
The past few weeks a short-term bottom line has been elusive. Bullish momentum divergence and over sold conditions can be seen in many risk areas of the market that are warning a bottom is near.
Today, the Nasdaq and the S&P 500 opened higher to form breakaway gaps in each index. Usually gaps act as support below the market and resistance above it. A breakaway gap is found at the beginning of a new trend, usually after some form of congestion. If the market is able to sell through the breakaway gap today that would point toward continued selling pressure, but if it holds, that can mark the way for solid support of a short-term bottom.

The first hurdle if the gap holds will be the 200-day moving average, currently at 2765. This was a level of support in previous corrections; however this correction that level was broken and stands to act as initial resistance to any counter rally.
There are a few sentiment and breadth indicators ahead that point to oversold conditions.
CBOE Options Total Put-to-Call Ratio
I’m using the total put to call ratio which includes both index options (what professionals typically use) and equity options (what individuals use) to illustrate that across the board we are at some extreme levels of hedging we haven’t seen since the 2015 correction.
I’m running a 10-day smoothing average on the indicator to take out some of the noise. A reading above 0.95 indicates bearish extremes; however, the signal will need to fall back below this level to confirm a longer-term bottom is in.

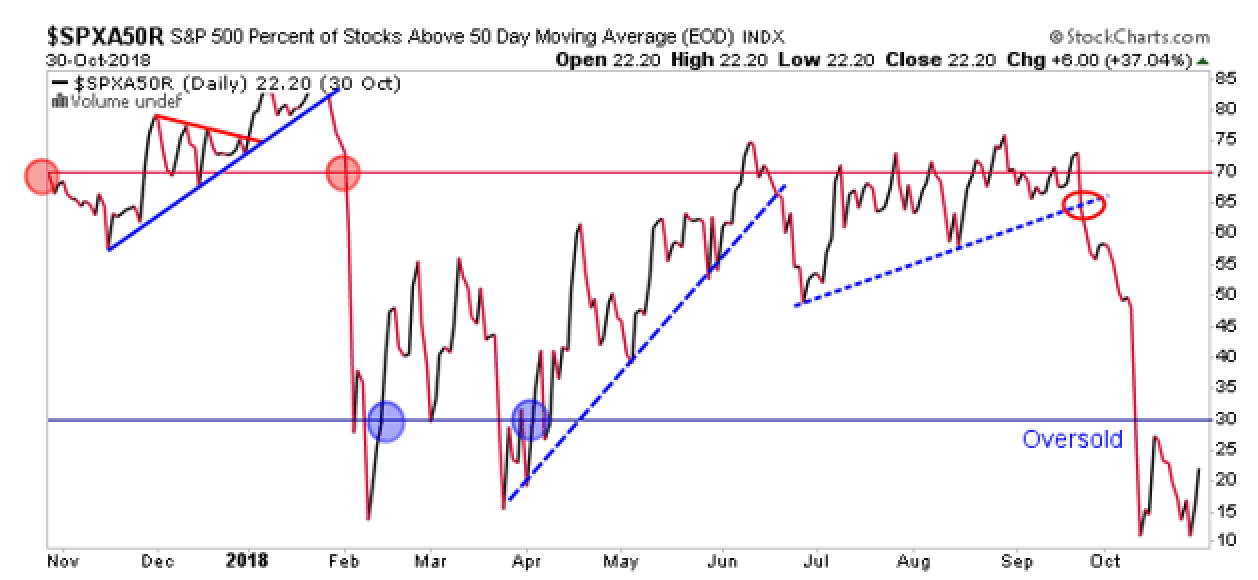
Percentage of Stocks Above 50-day Moving Average
The number of stocks participating in the market’s rally or correction is a great indicator to follow. Currently this is telling us that as of Tuesday, only 22 percent of the companies in the S&P 500 were still trading above their 50-day moving average. This is currently in oversold territory and a break back above 30 percent would confirm a short-term bottom is in.
Volatility Index
The Volatility Index (VIX) reached some lofty levels during this correction – levels we haven’t seen since the February correction near 26. Recently, the stock market has fallen to fresh lows in the past two weeks while the volatility indicator failed breaking to fresh highs. To me this is another sign of bullish divergence; however I wouldn’t say we have confirmation of a short-term bottom until the VIX drops back below 20.
Overall, I think the short-term conditions are ripe for a short-term bottom. That bottom can last days, weeks and months. I am worried about the long-term with a give-back of all of the returns year-to-date in U.S. stocks.
Above the surface this looks like just another 10 percent correction in an on-going bull market but there is some significant chart damage to the long-term outlook including several of the stock indexes deep below their 200-day moving average.
Additionally, the high-yield market using the iShares High Yield Corporate Bond ETF (HYG) unadjusted for interest shows a long-term top in place since 2017. Usually this market follows stocks higher as conditions improve in the economy after a recession and default risk is reduced. This chart indicates a worry over interest rates and possibly higher default risk in corporate bonds. That’s not a good sign under the surface.

Other below the surface damage is the break in the Dow Jones Transport Index chart and the test of February lows. A rally that fails to exceed the September highs over the next several months could spell a failure swing and the beginnings of a bear market which would also need to be confirmed in the Dow Jones Industrial Average, which also tested the February lows.

Damage has been done to the long-term trend but all is not lost. If this is the beginning of a bear market it will take time to develop. If it isn’t the start of a bear market, my feeling is that it may have been the end of the best part of growth this bull market had to offer; including the long run in semi-conductors that began in 2016.
Be tremendously cautious chasing high PE stocks in the final phase of this bull market. And be careful if the short-term bounce isn’t strong enough to propel the current correction out of this corrective period. The last correction lasted from February to May. The 2015 correction also based on growth slowing out of the U.S. lasted from August to February 2016. Just as tops are a process, so are bottoms. This was likely the first leg down and it is unclear as of yet if it is done until some of the breadth and sentiment indicators above confirm the levels I mentioned.


