


Existing home sales continued their historic plunge in July to reach the lowest level in 7 years outside of COVID, down roughly 1.7 million home sales in just the last six months.

To put the current pace of decline into perspective, the housing bubble peaked in 2005 and then rolled over heading into 2006, but the speed of the decline did not accelerate until it began to fall off a cliff in 2007.
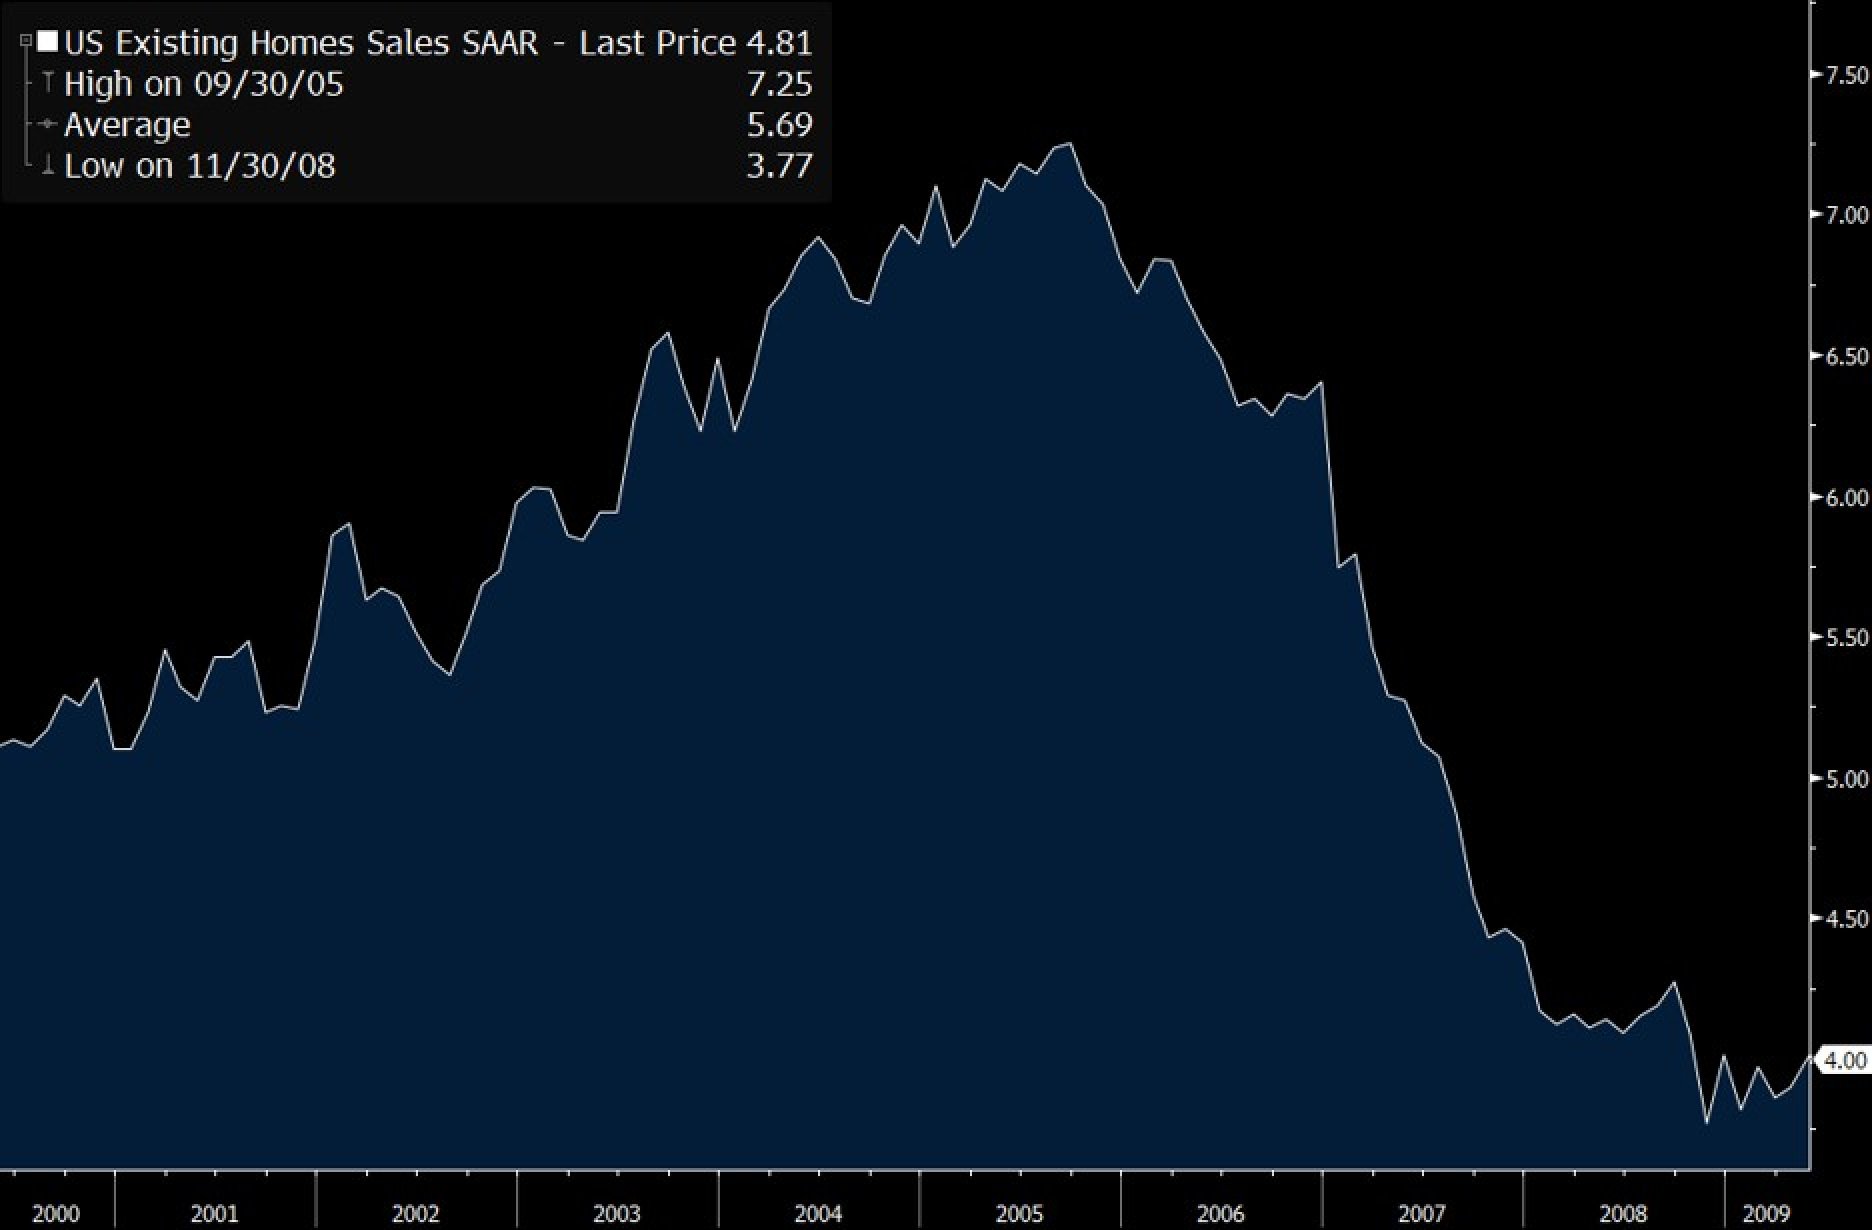
The recent 6-month slide in existing home sales is so steep that even the sharpest deceleration during the housing bubble could not match the recent pace in declining home sales in that it took 9 months to fall in 2007 to match the decline that took place in just 6 months in 2022.

This is easier to see when looking at the net 6-month change in existing home sales going back more than two decades. The current pace of decline is unprecedented.

We do not yet have July data for new homes sales (we get that next week) but look at the net 6-month change through June of this year, which shows the sharpest decline outside of COVID since mortgage rates were double digits back in the early 1980s:

Further discouraging news came from the Conference Board who posted that the July annual rate of change in their Leading Economic Index (LEI) plummeted to 0% from its high in 2021. It has now decelerated for fourteen of the last 15 months. Should it fall officially into negative territory in August, it would mark the 13th time since 1960 (or once every approximately 5 years). Of those twelve prior occurrences, 66% of them marked the early warning of a coming recession, while 33% did not.
Like what you're reading? Subscribe to our daily podcast for regular updates
Here are those times the LEI dipped below 0% with no recession within a year and a half, the coveted “Soft Landing”:
- 1967
- 1996
- 1999
- 2016
What do the odds look like now of another soft landing should we fall below 0%? NOT GOOD. Why is that? Well, when the economy was able to bottom from a soft level and then resume higher again, inflation during those periods was at a fraction of what we are dealing with today. The annual inflation rate at the LEI troughs during the prior soft landings are shown below:
Times LEI dipped below 0% with no recession within a year and a half = The coveted “Soft Landing”
- 1967 (Inflation was 2.8% at the LEI trough)
- 1996 (Inflation was 2.7% at the LEI trough)
- 1999 (Inflation was 1.7% at the LEI trough)
- 2016 (Inflation was 1.0% at the LEI trough)
What all those soft-landing downturns had in common was that the LEI only marginally broke below 0%. However, when it fell to -1% or more below zero, we fell into a recession every time:

Given the pace of our current decline, I believe we will likely exceed that -1% threshold this month, which we will not find out until a month later when the data is finally released in September.

Looking at the inflationary late 1960s to early 1980s period shows that once we breach -1%, a recession occurs at the same time or at the latest within 7 months.
Unless inflation magically goes away the next two weeks and drops below 3%, achieving a soft landing will be very difficult. What history has shown us is that the higher the inflation rate (lower panel below), typically the greater the fall in real GDP (top panel below):

With inflation running at a 40-year high, is it even reasonable or practical to assume we see a soft landing? The answer, I believe, should be a resounding “NO” and if a soft landing is not on the horizon and instead we are looking at an official recession, history has shown us the current “Fed pivot” rally will likely not last.
Considering the above, we believe caution is still warranted and is why we have a below neutral risk level.
To learn more about Financial Sense® Wealth Management, click here to contact us.
Advisory services offered through Financial Sense® Advisors, Inc., a registered investment adviser. Securities offered through Financial Sense® Securities, Inc., Member FINRA/SIPC. DBA Financial Sense® Wealth Management.
Copyright © 2022 Chris Puplava


