


It was close to four years ago I penned an article entitled “The 5% Solution”.
In that discussion I went all the way back to the 1950’s and tried to look at the fingerprint character of bull and bear equity markets since in terms of how equity averages have traded around their 50 day moving averages. Without belaboring the point or hopefully oversimplifying, equity bull markets have tended to trade relatively predictably in a 5% range both above and below respective 50 day moving averages. Was this character trait absolutely 100% reliable and definitive? Of course not as there have been times of minor price level violations seen above and below this 5% band that were extremely short lived and not necessarily indicative of any key new market “information”.
Interestingly, what accompanied early bear markets for equities was increasing price level experience seen at a price level 5% or more below the 50 day MA. The following chart is a look at what occurred in 2000 through 2002. Although the S&P peaked early that year, price in excess of 5% below the 50 day MA were very short lived until the latter part of 2000, the real beginning of the 2000-2003 equity bear. The giveaway to the real acceleration on the downside was the consistency of price violation in excess of 5% below the 50 day MA that began in late 2000.

Incredibly enough, we saw pretty much the exact same pattern in the 2007-2008 early equity bear period. It was in late 2007 and early 2008 when this price violation accelerated into what as to become a very meaningful downturn.

I won’t drag you through a multi-decade historical retrospective as you can find it all at the link I provided above.
Where are we in the current cycle? We’re not yet close, but I thought it important to again revisit this 5% price demarcation topic as I personally believe 2014 could easily be the year we get an interim correction of size. The numbers and rhythm of the markets will ultimately tell us of a true bear, or just an interim correction of magnitude.
I thought it worthwhile to look at the prior and current cycle to date for a bit of compare and contrast. Remember, this 5% price band is no hard and fast rule, but its historical consistency I believe is at the very least worthy of contemplation. So right to it, below is the history of this 5% band from 2003 to present.

Once again, you can see the incredible consistency of the prior 2003 to 2007 cycle. No violations of price below that 5% demarcation line from mid-2003 until 2007. At the link provided at the start of this discussion I look at the longer term experience of the S&P from the 1950’s through the 1990’s. Same deal.
But what a minute, from 2009 until present we meaningfully violated the theoretical 5% below 50 day MA rule on a number of occasions, none of which were early indications of an equity bear market. So what has generally worked historically is no longer working in the current cycle, right? No so fast. We all know this current cycle has been the anomaly of our careers on so many levels. Of course the poster child anomaly has been actions of the Fed and their global central banking brethren. So let’s take a bit of a closer look at life in the current cycle.
After the 2009 SPX lows, the first violations of the 5% 50 day MA level to the downside occurred from May of 2010 until July of 2010. As you may remember, QE1 came to a halt in June of that year and the Fed began hinting at QE2 in August of 2010, right as the 5% violations concluded for a time. Actual QE2 began in November of that year. We next saw a downside violation between August and September of 2011. The Fed’s operation Twist began in September of that year. Next up is a June 2012 violation. In that very same month the Fed announced an extension of Operation Twist. Finally in November of 2012 we saw the final violation of the rule through to the present. Interestingly, QE3 began in September of 2012 and was doubled to include Treasuries in December of the same year. Do you get the picture? Of course you do. Every single violation of the 5% level to the downside in the current cycle was met with accelerating Fed QE/Twist actions. What would have happened without Fed involvement? None of us will ever know.
The important point, of course, is that supposedly the Fed is now walking away from the game. A potential violation of this very simple rule will theoretically not be met with Fed action to further stimulate; at least that seems the game plan of the moment. So my suggestion is that 5% downside level below the 50 day MA now becomes an important watch point. Again, any guarantees in all of this? Nope, only suggestions of heightened risk management should it occur.
A few last comments and I’ll call it a day. We’re long overdue for a correction of size. I’ll make zero predictions of a true bear, but my stomach acid is telling me a correction is a real possibility. Last year I was very scared. Scared the market would melt up. This year with the pervasive year end bullishness, a correction of magnitude seems a better bet than not. I’ll leave you with a few last character points to contemplate.
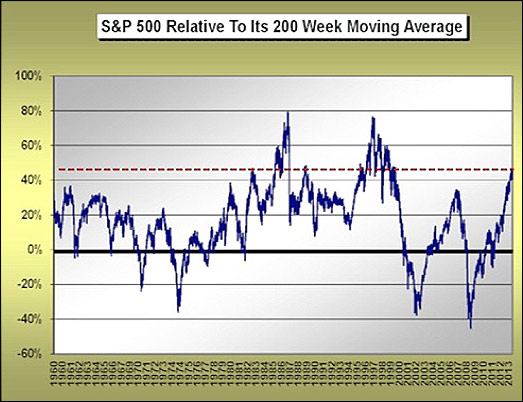
Right now, the S&P is more extended above its 200 week moving average than anything we have experienced since 1999. This is only the fourth time we have seen this type of extension in six decades. No predictions of some imminent demise, rather a “lesson” from direct historical experience.
Finally, just a few numbers from the historical vault of human experience. Below if a table that shows us for just how many weeks the equity market was able to meander without a 20% correction. This data cover the period from the bottom of the 1974 bear market to present.

As the numbers tell us, from the 1980’s to the present, excluding the secular 1987-2000 bull, the approximate 250 week level without a 20% price correction has been the outer limits. We’re once again there right now. No guarantees, juts reflections on historical human decision making.
For now, the year is still very young. C’mon, after last year, the “fault line” that is the US equity market is letting off a bit of pressure. Nothing could be healthier short term. But is it really the beginning of “the big one”. It’s way too early to call. But, as always, it’s never too early to employ a set of hopefully useful tools to guide us in this journey and ultimately in decision making.


