


On November 10th, using data from the November 9th close, we mentioned concerns relative to short-term reversals in some currencies, precious metals, and the VIX. From their lows to their subsequent highs, we did end up seeing the following:
- The dollar gained 7.6%
- The VIX gained 33.7%
From their highs to their lows:
- Gold fell 6.6%
- Silver fell 14.7%
- The euro dropped 9.2%

Our concerns on November 10th included bullish divergences showing up on the charts of the U.S. dollar. While it is too early to read too much into it, we now see short-term bearish divergences on the chart of the dollar. If the dollar were to weaken again, it should benefit gold, silver, and commodities in general. It would also help the euro. Weakness in the VIX may also accompany renewed weakness in the dollar.
Three charts have recently caught our attention. We hypothesized on November 30th the blue band shown below may act as resistance. So far, it seems to be holding in the real world, which leans bearish for the dollar.

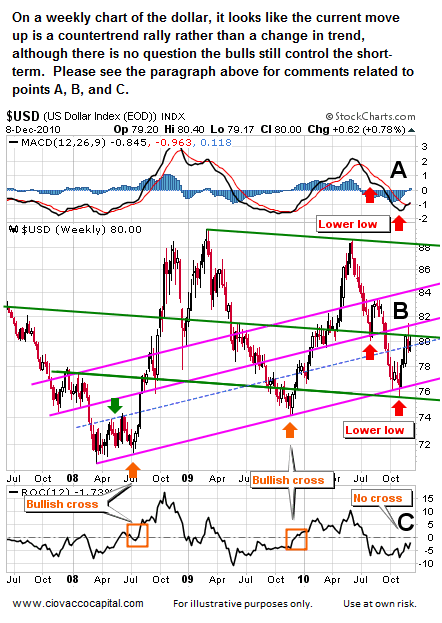
Healthy markets usually see a higher low in price accompanied by a higher low in technical indicators. When price makes a higher low and technical indicators make lower lows, we have what are known as a negative or bearish divergences. Often, not always, these divergences foreshadow a change in the short-term trend. The current short-term trend in the dollar is up. The divergences shown below need to be monitored since the dollar impacts numerous markets from gold to oil. It is possible the market will clear these divergences, but as long as they remain sustainable higher highs in the dollar will be less likely.

The weekly chart below is an updated version of the chart presented at the top of this article, with two technical indicators added (top and bottom). At point A, the MACD indicator made a lower low when price made a lower low – no divergence present – which “confirms” the low and tells us a lower low may eventually be in store. Near point B, notice how the trendlines drawn back on November 9th have recently acted as resistance for price (see pink and green lines). At point C, we have not yet seen a bullish cross in the Rate of Change (ROC) indicator, which also tells us a lower low may be in store for the dollar.
Charts do not predict the future; they simply allow us to monitor the present and recent past. The charts tell us the odds for further weakness in the U.S. dollar are increasing again. Using the terms “odds” and “probability” speaks to the need to remain flexible and open-minded should the markets begin to present different information. Currently, the bulls still control the U.S. dollar relative to the short-term trend. The bulls appear to be losing their grip somewhat. With Fed policy (quantitative easing) continuing to place pressure on the greenback, it is difficult to picture continued appreciation.


