As we head into the final two trading weeks of the year, the U.S. Dollar Index has completed two of the three steps typically associated with a change in trend: (1) the black trendline was broken, and (2) a higher low has been made. The third step would be to make a higher high via a daily close above 81.19.
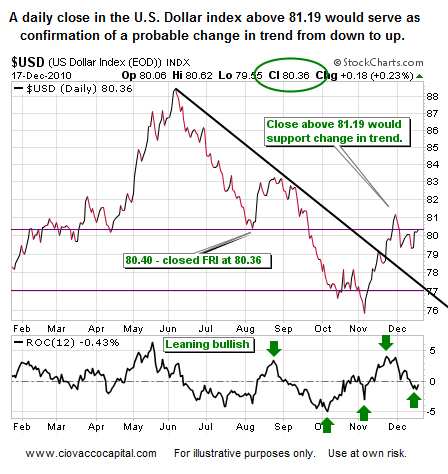
In the chart of the dollar above, the Rate of Change indicator (ROC at bottom) has made a few higher lows and higher highs, which leans toward the bullish camp. If we fail to see a close above .19, the door would remain open for the bears. One possible bearish development is the fact that ROC has not cleared the zero line again.
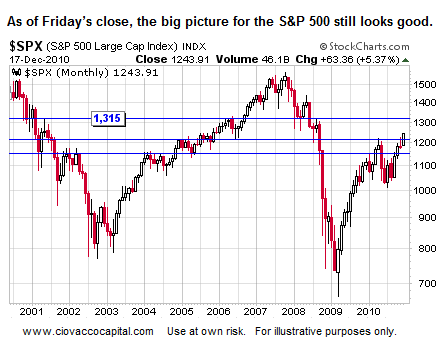
In our December 15th comments on the 2011 outlook for stocks, and risk assets in general, we presented several charts including the monthly chart shown below. The version shown here is as of Friday’s close. A move to 1,315 sometime in 2011 seems within reason.
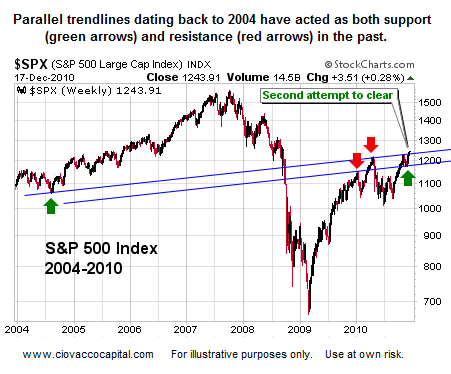
In the shorter-term, the S&P 500 faces several forms of possible resistance, including the long-term trendlines shown below. As noted, we are making a second pass at the upper blue trendline, which helped stem the market’s gains in April of 2010.