


The markets advanced early Tuesday after a report on home sales exceeded forecasts. On the earnings front, AT&T (T) and 3M (MMM) came in above consensus. With an important Fed statement and a durable goods report coming on Wednesday, we will be monitoring our market models, support, and moving averages closely.
After the recent rise in Spanish and Italian bond yields, it is possible the market is expecting too much from Wednesday’s Fed statement. From a bullish perspective, any hint of additional Fed asset purchases in the central bank’s statement could give a tired market a bullish injection.
The support table below is one of the ways we are tracking the market’s downside risk should the Fed disappoint. The levels shown come from two DeMark indicators, Setup Trend (TDST) and Propulsion (PROP). All things being equal, we would prefer to see the ETFs in the table remain above both of the potential forms of support. Red boxes show ETFs that were below the given level as of Tuesday morning. Green levels show ETFs that were above the given level as of Tuesday morning. On average, the ETFs remained 0.16% above TDST support and 0.95% above the PROP support.

In the table above, a bearish break of the PROP “support” levels could be followed by increasing momentum to the downside. ETFs that remain above the PROP levels will tend to maintain a bullish bias from a momentum perspective. DeMark indicators are proprietary tools offered by Market Studies, LLC.
When we study markets, we tend to classify them as bullish, neutral, or bearish. A “bullish correction” is one that remains relatively tame or is relatively short in duration. As shown in the table below, the median CCM 80-20 Correction Index (80-20) reading at the end of a “bullish correction” was 34. The 80-20 closed Monday at 37. None of our models have moved from bullish to neutral territory yet, which means some patience remained in order as of Monday’s close.

Should the values in the table above begin to breach neutral territory, it would increase the odds of a more substantial pullback. The CCM Asset Allocation model currently has a 67% exposure to risk, which respects the possibility of further downside while acknowledging all three major indexes remain above their 200-day moving averages (in red below).
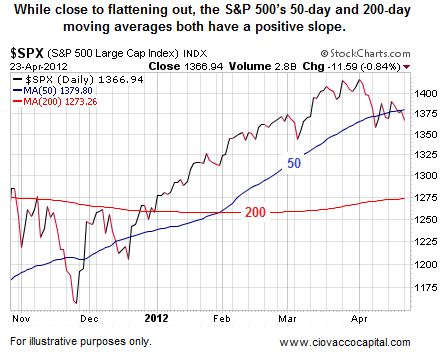
Not too many bad things can happen when the slope of the S&P 500’s 50-day moving average remains positive (shown in blue above). If the 50-day does turn over in a negative manner, it will send another “be careful” message to investors.
Source: Ciovacco Capital


