As we prepare for Friday’s employment report, it is a good time to review both the market’s outlook for the next few months and our possible investment approach. For those keeping score at home, the consensus forecast for Friday’s employment number is 180,000; the range of forecasts spans from 120,000 to 255,000. Thursday saw the biggest gain in stocks thus far in 2011. According to Bloomberg:
The Institute for Supply Management’s index of non- manufacturing businesses increased to 59.7 from 59.4 in January. The median forecast of economists projected the index would fall to 59.3. Same-store sales rose 4.3 percent last month, beating an overall compilation of analysts’ estimates for a gain of 3.8 percent at the 27 chains tracked by Retail Metrics. Separate government data showed productivity climbed more than estimated and labor costs dropped more than forecast.
Market breadth was decidedly positive Thursday, especially the up/down volume stats for the NASDAQ. Trading volume was slightly higher than the previous session on both the NASDAQ and S&P 500, but a little disappointing relative to the magnitude of the gains.
This week we have updated our asset allocation models, which allowS us to compare 220 asset classes/sectors/investments head-to-head. We have a short list of possible buy candidates should it be needed on Friday. The recent strength in economic data still has energy (XLE) and numerous energy-related subsectors looking attractive, including oil & gas equipment and services (XES), oil & gas exploration and production (XOP), and oil equipment providers (IEZ).
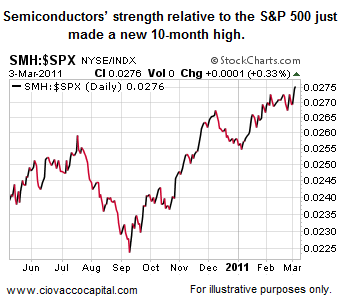
An economy that may not have been hurt as bad as anticipated by rising oil prices also puts the broad market (VTI) and economically-sensitive semiconductor manufacturers (SMH) on our short-list of possible buy candidates. Agriculture (DBA) has been consolidating for a month and may be poised to regain traction should the market applaud the much-anticipated employment report due Friday morning at 8:30 a.m. ET.
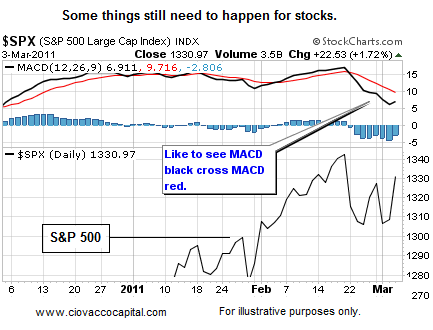
We would prefer to see the market’s reaction to tomorrow’s employment number before making any moves. While Thursday’s market was impressive, numerous short-term indicators, including MACD, have not crossed bullish thresholds, meaning we will remain patient with cash until we see what we want to see. For those who want more technical analysis, this post shows additional things we are looking for in terms of feeling better about the recent rally attempt.
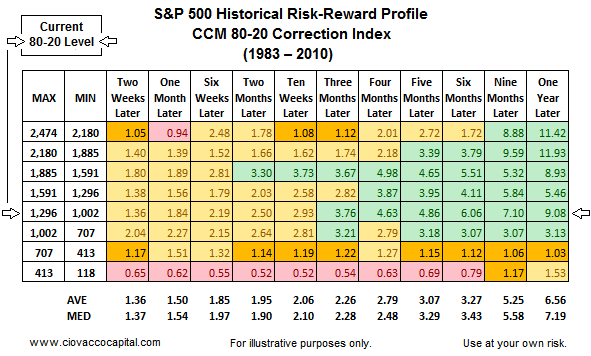
In terms of the market’s outlook for the coming months, the CCM 80-20 Correction Index tells us the market’s current profile has produced favorable results more often than not over a three-to-twelve month time horizon. As we mentioned on March 2, we are still concerned about corrective activity, but we are not concerned about a full-blown bear market at the present time.
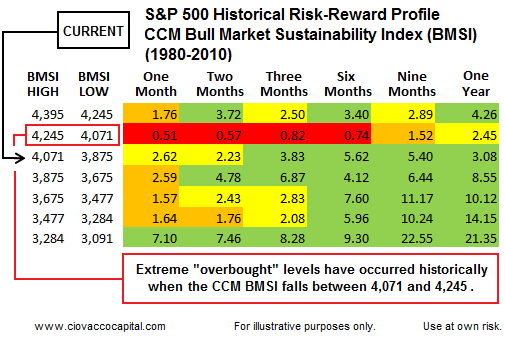
Similarly, the CCM Bull Market Sustainability Index (BMSI) also points to a favorable risk-reward profile for investors looking out three-to-twelve months.
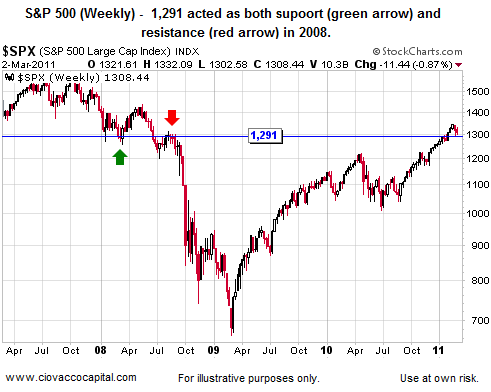
As shown below, the S&P 500 still sits above potential support from 2008. The recent intraday low was 1,294, which was made last Thursday. As long as we hold above 1,294ish to 1,291ish, it makes sense to hold our current positions.