


In the context of recent history, weak job creation numbers are not all that troubling. In the early 1990s, job creation was tepid as we emerged from a recession in March of 1991. From March of 1991 through year-end 1993, the S&P 500 gained 26% during a “jobless recovery”. It is true markets do not like surprises, but weak job creation is a surprise to no one (see this FSO post for more). In a similar vein, we noted recently in Consumer Confidence Not A Death Knell For Stocks, it is important that we try to differentiate between economic concerns and economic concerns that historically have derailed bull markets.
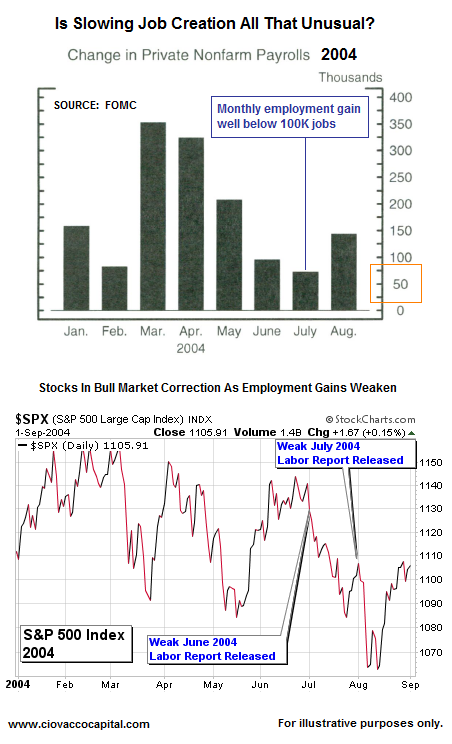
The current market and economic cycle is very similar to the last cycle (stocks bottomed in March 2003 and March 2009). The last bull market had to endure four months of slowing job growth in 2004, including “terrible” job creation of less than 100K in the summer of 2004 (similar to what we have seen recently in 2010). Like 2010, stocks corrected in 2004, and it felt like a new bear market had started.
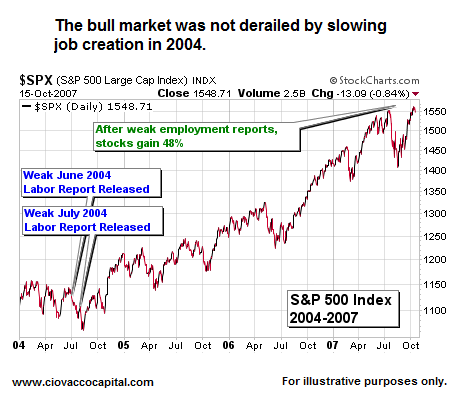
Stocks did quite well after four months of slowing job growth in 2004. Those who remained patient were generously rewarded with gains approaching 50% from the 2004 correction lows. Every cycle has some unique characteristics, but they also have numerous similarities. The events of 2004 remind us the importance of understanding history and keeping an open mind (which is not easy to do in the face of volatile markets).
We may still have a few weeks or a few months of difficult times, including some more disappointing reports on the employment front, but at this point the odds still favor higher highs in stocks later in 2010 or in 2011. A new bear market is possible, but not probable with the information we have in hand. We respect there are still problems with banking, debt, and credit. It is possible, in terms of asset prices, that fundamental weaknesses could be offset with supportive policy shifts from the Fed later this year of early in 2011. This was not the case in 2004 as markets had to withstand the early stages of a rate hiking cycle. James Bullard's recent Fed paper, "The Seven Faces of The Peril", could be signaling another "bazooka-type" round of money printing is in the works.
From a probabilistic and historic perspective, the risk-reward profile of the stock market remains favorable, especially over the next three months to a year. The CCM Bull Market Sustainability Index (BMSI) closed Wednesday at 2,406. Similar market profiles in the past have produced the risk-adjusted results shown below. Keep in mind, the orange and yellow portions of the table below still represent favorable conditions. However, the risk-reward profile of the stock market improves as we move further out, which is exactly what we want to see. Obviously, the term risk-reward implies all markets have risk, including the current market. The concern in present day, which could legitimately fall into the "it's different this time" category, is the real threat of deflation.
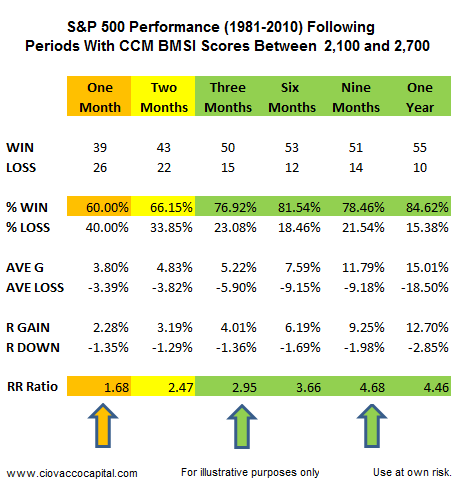
What makes the current market profile so appealing is similar profiles have produced higher stock prices 81.54% of the time six months later. That figure gets even better over the following year with stocks being higher in 84.62% of the historical cases. The current BMSI score tells us the market may remain volatile in the next 60 days. However, the odds are good stocks will be higher in the next 90 to 365 calendar days.
We have been working for several months on the CCM 80-20 Correction Index.We are still doing some analysis on historical data and will continue to report our findings in the coming days and weeks. However, we are far enough along in the process to know the 80-20 Correction Index is not yet flashing warning signs in terms of there being a high probability of significant and prolonged corrective activity from current levels (we remain more concerned about a bear market). Of the 56 significant historical corrections we studied to create the 80-20 Index, the lowest daily 80-20 score where a significant correction began from was 459. The majority of corrections began with daily scores between 642 and 734. The daily score as of Wednesday’s close was only 396, which is a positive for the time being.
The markets remain fragile, but with a bullish bias over the next six to twelve months. The market's focus on deflationary forces is warranted. How things unfold on this front, as well as any Fed responses, will most likely dictate if it is different this time. More comments on these topics can be found in Short Takes.
This article contains the current opinions of the author but not necessarily those of CCM. The opinions are subject to change without notice. This article is distributed for informational purposes only and should not be considered as investment advice or a recommendation of any particular security, strategy or investment product. The charts and comments are not recommendations to buy or sell any security. Market sectors and related ETFs are selected based on his opinion as to their importance in providing the viewer a comprehensive summary of market conditions for the featured period. Chart annotations are not predictive of any future market action rather they only demonstrate the opinion of the author as to a range of possibilities going forward. All material presented herein is believed to be reliable but we cannot attest to its accuracy. The information contained herein (including historical prices or values) has been obtained from sources that Ciovacco Capital Management (CCM) considers to be reliable; however, CCM makes no representation as to, or accepts any responsibility or liability for, the accuracy or completeness of the information contained herein or any decision made or action taken by you or any third party in reliance upon the data. Some results are derived using historical estimations from available data. Investment recommendations may change and readers are urged to check with tax and investment advisors before making any investment decisions. Opinions expressed in these reports may change without prior notice. This memorandum is based on information available to the public. No representation is made that it is accurate or complete. This memorandum is not an offer to buy or sell or a solicitation of an offer to buy or sell the securities mentioned. The investments discussed in this report may be unsuitable for investors depending on their specific investment objectives and financial position. Past performance is not necessarily a guide to future performance. The price or value of the investments to which this report relates, either directly or indirectly, may fall or rise against the interest of investors. All prices and yields contained in this report are subject to change without notice. This information is based on hypothetical assumptions and is intended for illustrative purposes only. PAST PERFORMANCE DOES NOT GUARANTEE FUTURE RESULTS.


