


Last week on Financial Sense, we closed with the following:
The financial markets have deteriorated in a rapid fashion, which is something that needs to be acknowledged and respected. We are at one of those points where you need to be ready to sell, but selling too early could prove very frustrating should the markets recover strongly before year-end.
Since last week's low of 1,010 on the S&P 500, stocks have gained 5.86% as of Thursday's close. A significant part of the reasoning behind maintaining a bullish bias in a period where the markets are walking a fine bull/bear line can be summarized as follows:
* Pauses in economic recoveries are not uncommon.
* A significant and prolonged (several months) correction in risk assets is not unusual for this part of the economic cycle.
* During corrections in the early-to-mid part of an economic recovery cycle, stocks have a much more favorable risk/reward profile than during corrections that occur in the mid-to-late part of the recovery cycle.
Another bullish factor is the possible gains that can follow a sharp correction. The table below clearly illustrates the further rationale for trying to hold the majority of our positions during this difficult period for investors. The CCM Bull Market Sustainability Index (BMSI) was created to help better discern between periods where our bias should be "buy and hold" and periods where our bias should be defensive in nature. Last Friday’s BMSI hit a low for this correction coming in at 834. In the period 1981-2010, there have been ten cases where significant corrections ended with the BMSI between -923 and 1,663. The table below shows the S&P 500’s performance after the BMSI and stocks found their footing following a significant correction. Notice some of the largest gains came after BMSI scores fell between -923 and 786 (we were recently at 834). As long as the BMSI remains above -923, the risk/reward profile of the market actually improves if we fall further from current levels. This makes intuitive sense; at some point during a corrective process the sellers become exhausted (the last person sells who wants to sell). Then bargain hunters can push prices higher, sometimes in a rapid fashion, since they have to contend with very little pressure from sellers.
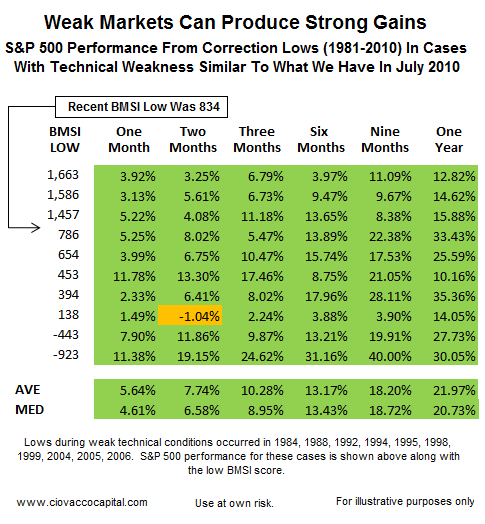
While numerous factors, such as the current stage of the economic cycle, favor a rally into year-end, we cannot assume the market will hold or the BMSI will remain above -923. We have reached a point where we must balance principal protection with the desire to remain invested. Upon further market weakness, we will have to consider gradually reducing risk since principal protection is always important. In the coming days and weeks, if our research indicates the odds have shifted in favor of additional declines, we will begin to raise cash in a more rapid fashion.
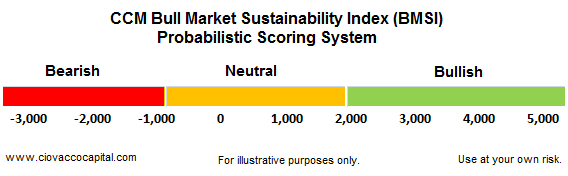
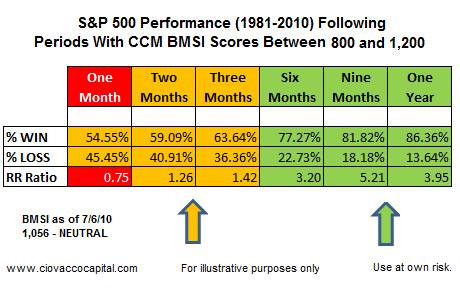
On Tuesday night (07/06/10), the BMSI came in at 1,056, which falls into neutral territory (see above). BMSI scores between 800 and 1,200 during the period 1981-2010, were followed by gains in stocks over the next year 86% of the time (see table below). The nine month period following BMSI scores between 800 and 1,200 gave investors a 5.21-to-1 risk/reward ratio, which is very favorable. The orange and red portions of the table below show the next one-to-three months could continue to produce some more uneasy times.
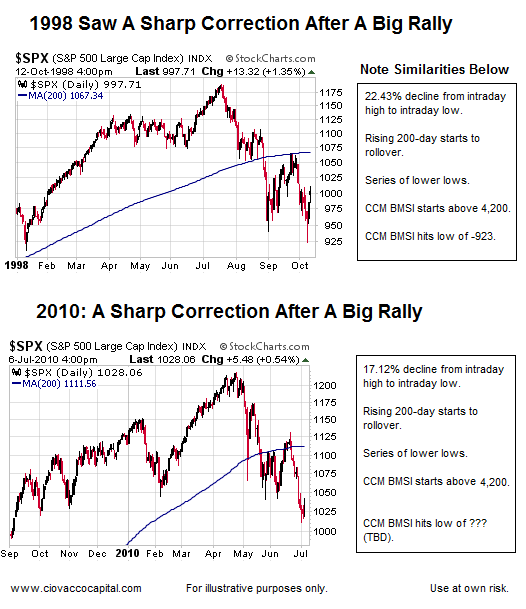
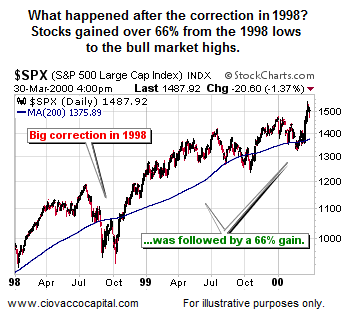
Sometimes after selling some positions during a correction, you look back at history and say, "Hmmm....this has happened before and holding was the right thing to do". The current correction may morph into a full-blown bear market, but the odds still favor a rally sometime in the next eight weeks or so. 1998 is an example from history where holding turned out to be the proper move. The current market needs to be monitored closely with an open mind, but making decisions with knowledge of how markets have behaved in the past can be extremely helpful at times. We compare 1998 and 2010 below - followed by what happened in 1998 after the correction ended.
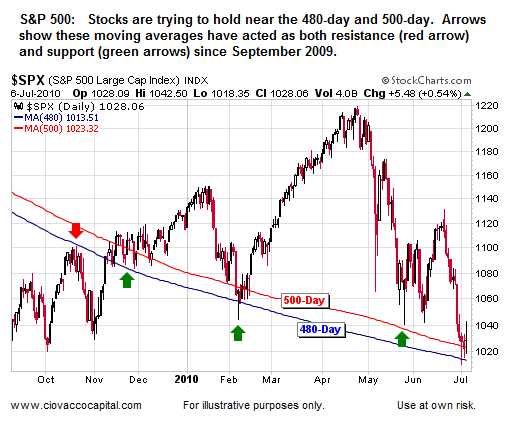
We mentioned the 500-day and 480-day last week. Below is an updated chart as of Tuesday's close. As of the close on Thursday, the S&P 500 was above both the 500-day (now at 1,022) and the 480-day (1,012), which is some good news after weeks of nothing but bad news.
While it is way too early to make any definitive or even probabilistic statements, as we head in to trading on Friday (07/09/10) it is possible we have seen the lows for the year - emphasis on possible. The S&P 500’s relative strength (RSI) remains below 50 on a daily chart (closed Thursday at 48). An RSI above 50, and better yet 52, would greatly increase the odds of at least a short-term rally (2 to 3 weeks). Until RSI can make some lasting progress, this week's gains do not mean we are out of the woods; maybe closer to the edge of the woods, but not out.
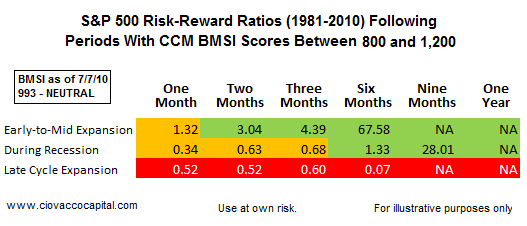
The CCM BMSI closed Wednesday (07/09/10) at 993, up from Friday’s reading of 834. Historical Bi-Weekly BMSI scores between 800 and 1,200 occurred during recessions, early-to-mid cycle expansions, and late cycle expansions. Historical risk/reward ratios are shown in the table below. Higher risk/reward ratios are more favorable. A ratio of 1.00 would denote a situation where the upside and downside risks are equal. Recent economic data, including the ISM Non-Manufacturing Composite Index, continue to point to slower growth, but not a double-dip recession. If the odds of a double dip remain low, then the late cycle expansion figures in the table below become less concerning. We believe we will get slower, but positive economic growth (GDP) going forward, which is based on hard economic data in hand, not an opinion about future events. If that is the case, the most relevant risk/reward ratios in the table below are the early-to-mid cycle expansion figures present on the top line, which are very favorable. A green NA is the best situation where all historical cases saw a higher S&P 500. A red NA is the worst case scenario where all cases produced stock market losses.
Wall Street analysts tend to be a little overly optimistic with their earnings forecasts, but even in that light, current earnings projections are holding up well. From Bloomberg:
Analysts are raising earnings estimates for U.S. companies at the fastest rate since at least 2004 just as stocks post the biggest losses in 16 months on concern that the economy will sink back into a recession. Profit for Standard & Poor’s 500 Index companies will jump 34 percent in 2010, compared with a projected gain of 27 percent on March 29, according to more than 8,000 estimates compiled by Bloomberg. The revision, the most during any quarter in at least six years, came as lower-than-forecast home sales, manufacturing and private-sector job growth sent the benchmark gauge for American equities down 16 percent since April 23.
Last week, we mentioned stocks could surprise by year-end. Some hopeful signs supporting that thesis are being given in the commodity, currency, and stock markets. Specifically, recent moves in the U.S. dollar, crude oil, Australian dollar, S&P 500, emerging markets, and Sweden provide some additional evidence a double-dip recession is not as likely as some believe.
Despite monster deficits, the U.S. dollar has served, somewhat ironically, as a safe haven currency since the financial crisis began in late 2007, early 2008. While the U.S. dollar’s impact on the markets is often overstated, the pattern has been when investors are risk averse, they buy U.S. dollars; when they are more willing to embrace risk, they tend to sell U.S. dollars.
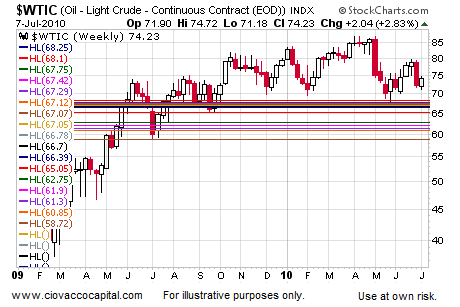
Without much fanfare, the U.S. dollar has dropped for six straight weeks, including the current week. This may be foreshadowing a return of risk appetite, which would tend to be good for stocks, commodities, and commodity-dependent currencies. All things being equal, if you are bullish on risk, you would rather see a weak dollar than a strong dollar. Weekly charts are shown in all cases below.
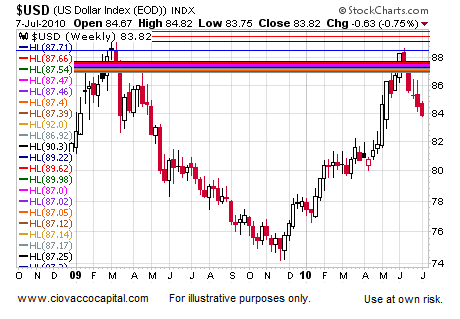
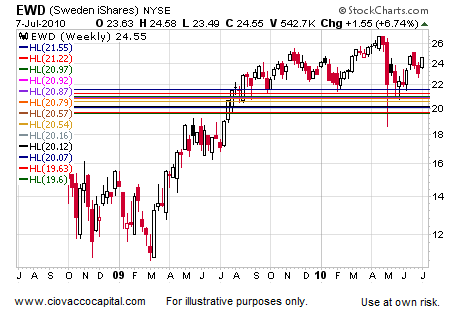
We use larger versions of the charts shown here (directly above and below) to monitor price levels where buyers have perceived value in the past and price levels where buyers have felt a market is expensive. Past behavior can help us with possible future behaviors. The horizontal lines represent areas that have been important to market participants in the past, sometimes going back to the 1990s.
Crude oil’s recent relative strength does not support an imminent double-dip recession. Unlike the S&P 500, crude oil did not make a lower low in June. The fact buyers did not allow crude to make a lower low tells us something about their perception of future economic growth. Admittedly, a move of this duration could be a simple bounce, but a positive turn has to start somewhere.
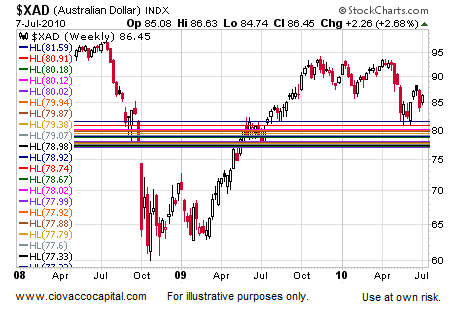
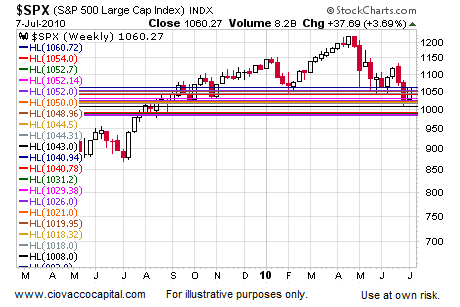
Australia’s economy is highly dependent on the global demand for commodities. It stands to reason the Australian dollar is highly correlated to the commodity markets. In the past, market participants have become interested in the Australian dollar in a range between roughly .00 and .50. As if on cue, buyers recently stepped in as the Australian dollar dropped below .50. Continued strength in the Australian dollar would be an encouraging sign for future economic growth and risk assets in general. Recent economic data points to slower growth, but slower growth is not synonymous with a double-dip in terms of its possible impact on bull markets. The chart of the S&P 500 is shown for comparison purposes. The relative strength of oil, the Australian dollar, and emerging market stocks (below) do not seem to align with a recession being around the corner.
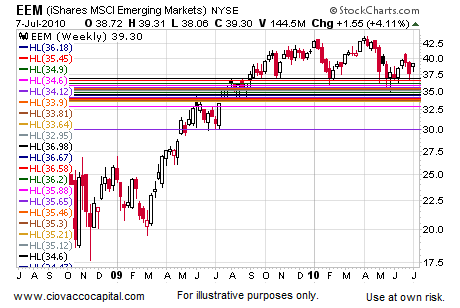
If you are bullish on risk longer-term, you should hope emerging market stocks begin to reassert some leadership. Emerging market economies have grown in terms of their significance to overall global growth. Emerging markets bottomed first as we entered the current bull market. Unlike the S&P 500, they have not revisited their lows made in late May 2010; this is also a positive sign for risk in general.
The news from the European Union has been a tad on the negative side in recent months. The European Union is composed of 27 sovereign Member States: Austria, Belgium, Bulgaria, Cyprus, the Czech Republic, Denmark, Estonia, Finland, France, Germany, Greece, Hungary, Ireland, Italy, Latvia, Lithuania, Luxembourg, Malta, the Netherlands, Poland, Portugal, Romania, Slovak Republic, Slovenia, Spain, Sweden, and the United Kingdom. While Sweden does NOT use the euro as its currency, any positive news coming from Member States helps lessen concerns about a total meltdown in the European debt markets. Sweden’s equity markets (represented via the ETF below) have not made a new intraday low since the early May flash-crash, which shows impressive relative strength vs. other risk assets.
All the markets above may be participating in a dead cat bounce, but given where we are in the current economic and market cycle (relatively early), we believe these are hopeful signs that should be monitored. Many market participants have been waiting for an opportunity to sell into a rally, which means we should expect some bouts of selling even if stocks manage to get up off the deck. Our bias has been, and remains bullish because our research indicates recent weakness has not yet stepped outside the bounds of a acceptable correction within an ongoing bull market. We readily admit the bounds of an acceptable correction have been pushed nearly to the limit, meaning renewed weakness in the weeks ahead could push us into bear market territory. We will continue to keep an open mind about both positive and negative outcomes. For now it looks bad, but not yet "bear-market bad".
Additional comments can be found in Short Takes.
Terms of Use. The charts and comments are only the author’s view of market activity and aren’t recommendations to buy or sell any security. Market sectors and related ETFs are selected based on his opinion as to their importance in providing the viewer a comprehensive summary of market conditions for the featured period. Chart annotations aren’t predictive of any future market action rather they only demonstrate the author’s opinion as to a range of possibilities going forward. All material presented herein is believed to be reliable but we cannot attest to its accuracy. The information contained herein (including historical prices or values) has been obtained from sources that Ciovacco Capital Management (CCM) considers to be reliable; however, CCM makes no representation as to, or accepts any responsibility or liability for, the accuracy or completeness of the information contained herein or any decision made or action taken by you or any third party in reliance upon the data. Some results are derived using historical estimations from available data. Investment recommendations may change and readers are urged to check with tax advisors before making any investment decisions. Opinions expressed in these reports may change without prior notice. This memorandum is based on information available to the public. No representation is made that it is accurate or complete. This memorandum is not an offer to buy or sell or a solicitation of an offer to buy or sell the securities mentioned. The investments discussed or recommended in this report may be unsuitable for investors depending on their specific investment objectives and financial position. Past performance is not necessarily a guide to future performance. The price or value of the investments to which this report relates, either directly or indirectly, may fall or rise against the interest of investors. All prices and yields contained in this report are subject to change without notice. This information is based on hypothetical assumptions and is intended for illustrative purposes only. PAST PERFORMANCE DOES NOT GUARANTEE FUTURE RESULTS.


