


Up until August, this year had been fairly dull as the S&P 500 was in a trading range somewhere between 1250 and 1350. July ended near the upper end of that range and by August 2nd we were once again testing the lower 1250 level. Over the following week the S&P 500 plunged roughly 150 points to hit 1101 on August 8th before rallying. The selloff was due to a slew of negative economic releases which led to lowered economic growth expectations as well as renewed concerns over European sovereign debt markets and banks. Since August 8th the S&P 500 rallied just under 10% before selling off once more. The S&P 500’s trading range is now between 1205 and 1120, and unfortunately I think we may have another repeat in which negative economic releases and continued worries over Europe may see the current trading range broken to the downside with the markets erasing all of QE2’s rally from 2010.
Future Econ Data Docket Will Move Markets
What really spooked the markets this past month were the Michigan Consumer Sentiment’s plunge, the early release of Q2 GDP, and the Philadelphia Fed Survey, all of which showed declines and were well below the consensus forecast. Other regional Fed manufacturing surveys like the New York Empire Index and the Richmond Fed’s Manufacturing Index data for August also showed contractions and sent the markets lower.
Outside of a few reports this month most of the data released was for July, which saw a bounce in economic activity. The big concern going forward is what these reports will show for August as it appears economic activity has stalled. Over the course of the next two weeks we will be treated to several big economic releases and only one of them is for June and one for July, with the bulk of the releases showing August data. The table below is just a sample of the big economic releases to keep an eye on ahead.
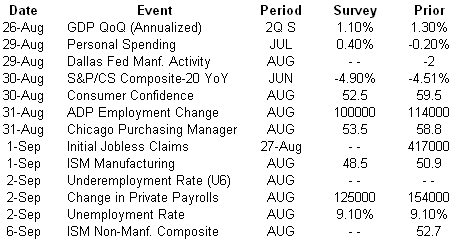
Source: Bloomberg
Just as the Economic Cycle Research Institute’s (ECRI) managing director Lackshman Achuthan called it back in January of this year, global growth has hit a wall this summer (“No Light Ahead for U.S. Job Seekers”). Based on the ECRI’s long-leading economic indicators they made the call in January of this year that the pace of industrial growth globally would be throttling back this summer and there would be a brief respite as Japan came back on line. Back in January when he made the call for a manufacturing slowdown he did not know if this would spillover into the service economy so that the broad economy (manufacturing + service) would feel the growth slowdown. Incoming data has since shown both sectors of the economy are slowing coincidently which puts the overall economy at risk of slipping into a recession. The growth brick-wall that Lackshman called for to occur this summer is clearly visible below in the following economic chart mosaic which shows employment worsening, manufacturing rolling over, and consumer sentiment and spending patterns also taking a turn for the worse.
Click here to enlarge
Source: Bloomberg
Click here to enlarge
Source: Bloomberg
The deteriorating trend in the economic releases above are clearly visible and its these releases that we will be treated to over the next two weeks for August’s data, and why I am not optimistic about the market’s outcome save massive money printing from the U.S. and Europe.
Global Financial Stress Continues to Rise
“Only when the tide goes out do you discover who’s been swimming naked”
-Warren Buffett
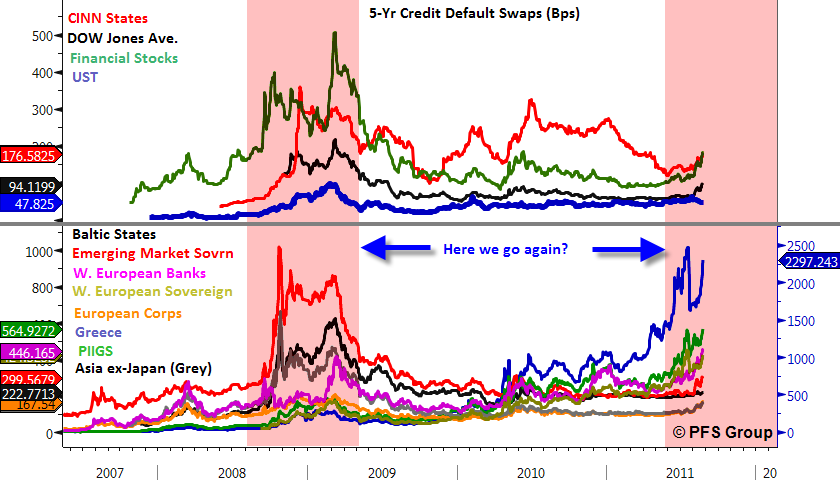
When economic activity decelerates you begin to see who has been “swimming naked”, as Buffett says, as those in the worst financial stress and those most leveraged are the first to deteriorate. While the financial crisis of 2008 that infected the world may have found its origins in the U.S. subprime fiasco, it appears this time around “ground zero” is the European banking crisis. The crisis with Greece first erupted in 2010 and it had a material affect on the U.S. and other economic regions, but stress began to fade as credit default swaps (CDS) in the U.S. declined in the back half of 2010. However, CDS levels in Europe basically moved sideways and never really came down. This second wave of European banking stress has now pushed CDS levels in Europe well above the highs seen in 2010 and now U.S. financial stress appears to be picking up as well and accelerating higher. The parabolic moves we witnessed in 2008 in CDS levels appears to be occurring once more as financial stress gathers momentum.
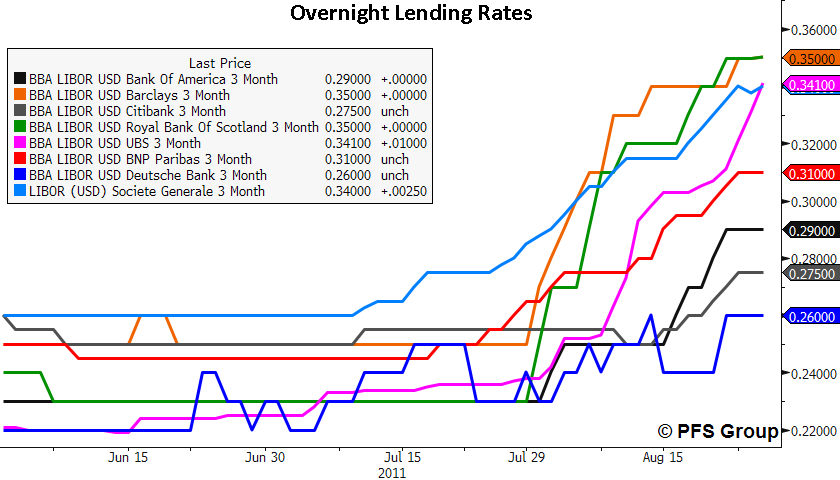
Also, just as in 2008, overnight lending rates between banks is rising as counterparty risk becomes a concern once more.
While Bernanke’s QE2 and prior Greek bailouts helped alleviate financial stress over the past year, take a look at the CDS figure above and you will see we are no better for it. Greek CDS (blue line, lower panel) are approaching their recent highs as if there hasn’t been any Greek bailouts and U.S. financial stress is right back to where it was before Bernanke launched QE2. I can’t help but think of Edwin Starr’s “War” lyrics in which I take the liberty of modifying:
Money Printing, huh, yeah
What is it good for?
Absolutely nothing
The same issue we faced back in 2008 remains, too much debt. You can’t solve a debt problem with more debt and while you can paper over debt with money printed out of thin air as Fed Chairman Bernanke has done, it’s the lower economic end of society that feels the pain of higher commodity inflation. Rather than let bond holders and commercial banks take the pain for restructuring current debt imbalances, central banks continue their endless stream of bailouts. With the global economy slowing we are likely to see further financial stress ahead and yet an ever larger stream of bailouts.
Expect a rough two-week period ahead as August economic data is very likely to show further slowing. Until the Fed enacts more money printing and the government more bailouts and fiscal stimulus, I would stress caution ahead as defense and capital preservation should remain the dominant investment theme.


