


Since late 2009 China has maintained a monetary tightening regime in which money supply growth rates have fallen and bank reserve requirements have risen. The monetary tightening programs have been aimed at cooling Chinese property prices as well as overall inflation levels. With a tight monetary backdrop, Chinese equities have made little headway after a strong showing in early 2009. However, with Chinese inflation in the process of peaking China may soon be able to reverse course and adopt a monetary easing policy to spur economic growth from cooling too far. If the country does move in this direction then Chinese equities may be a surprise story for 2012.
Chinese Inflation Peaking Should Bring Relief to Chinese and Global Manufacturing
Inflation has turned out to be a major growth killer over the last few years as it not only eats into consumers' wallets but also corporate profits as profit margins get squeezed. Perhaps the clearest example of this was how record oil prices in 2008 brought global growth to a standstill and the waterfall collapse in oil back into the $30/barrel region late in 2008 significantly brought down inflationary pressures. Yet another example was triple-digit oil prices earlier in the year that led to spiks in inflation globally months later and helped lead to a global slowdown in economic growth rates. Given the full impact of inflation and disinflation tend to reverberate within ecnomies months down the road as it takes time to incorporate price increases, the peak in inflation rates seen earlier in the year are likely to provide a much needed boost to economies in the months ahead.
We can see the interplay between inflation and manufacturing in the image below which looks at the Purchasing Managers Index (PMI) for both Chinese and global manufacturing alongside inflation indicators. Given the inverse relationship between inflation and economic growth rates, the inflation indicators on the bottom panel are shown inverted for directional similarity and advanced sveral months. As you can see, the prices paid PMI for China and the UN Food Price Index have both peaked (bottomed in chart) as inflationary pressures ease and they are implying we may see a Chinese and global manufacturing rebound heading into Q1 2012.

Source: Bloomberg
The inflation indicators in the bottom panel above often lead overall Chinese CPI rates and their peak seen earlier in the year is just now showing up in Chinese CPI rates. While China’s CPI is just now peaking, we are likely to see their CPI continue to fall well into 2012. Perhaps one of the best leading indicators for Chinese inflation is the growth rate in their money supply (M1). As seen below, Chinese M1 growth rates which lead Chinese CPI rates by 10 months suggest Chinese inflation should be falling for most of 2012.

Source: Bloomberg
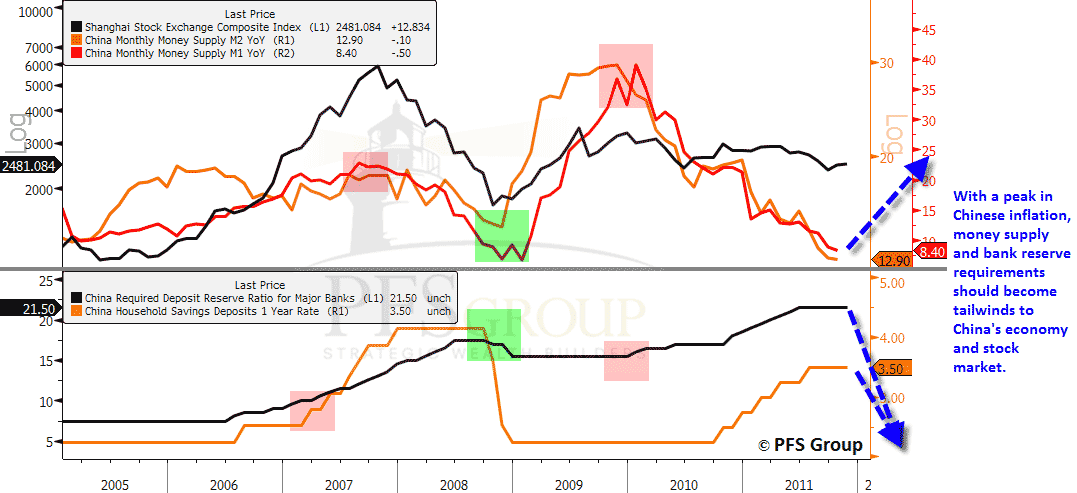
Receding inflation threats would provide the cover for Chinese authorities to boost Chinese money supply growth rates and lower required deposit reserves for Chinese banks. This was what helped propel Chinese stocks late in 2008 as money supply growth rates accelerated and bank reserve requirements eased (see green boxed below).
Source: Bloomberg
With inflationary pressures set to cool heading into 2012, Chinese stocks may have their first major tailwind in some time as monetary policy may move from tightening to easing. Monetary easing would not only likely boost China’s stock market but also its economy. This would have direct implications for commodities and the countries and companies that produce them as China, despite representing only 9.4% of global GDP and possessing 19% of the world’s population represents the lion share of global commodity demand.
Some Jawdropping Facts About Chinese Commodity Consumption
- Cement demand represents 53.2% of global demand
- Iron ore = 47.7%
- Coal = 46.9%
- Pigs = 46.4%
- Steel = 45.4%
- Lead = 44.6%
- Zinc = 41.3%
- Aluminum = 40.6%
- Copper = 38.9%
- Eggs = 37.2%
- Nickel = 36.3%


