


Summary
- Hindenburg Omens using NYSE data can be misleading
- Using stock-only indices provides better signals
- Russell 2000 had an Hindenburg Omen trigger on Black Friday
- Given extended nature of the current advance, some weakness likely ahead
Every now and then the financial media is abuzz when a Hindenburg Omen is signaled and investors turn cautious. A short description of the frightening market-event is provided below from Wikipedia. Named after the famous Zeppelin airship that exploded in a disastrous fire...
The Hindenburg Omen is a combination of technical factors that attempt to measure the health of the NYSE and, by extension, the stock market as a whole. The goal of the indicator is to signal increased probability of a stock market crash.
The rationale is that under "normal conditions" a substantial number of stocks may set either new annual highs or new annual lows, but not both at the same time. As a healthy market possesses a degree of uniformity, whether up or down, the simultaneous presence of many new highs and lows may signal trouble.
Theoretically, the Hindenburg Omen could be applied to any stock exchange; however, some minor alterations to the omen might be needed to achieve similar results.
While the market does not enter a crash or bear market after every cluster of Hindenburg Omen signals, every market crash or bear market has been preceded by a Hindenburg Omen. That is similar to the Wall Street axiom that the stock market has predicted 12 of the last 10 recessions. However, because every bear market or crash has been preceded by a Hindenburg Omen signal, they should not be dismissed.
In essence, market prices must observe the fundamental law of supply and demand: If there is greater demand for a stock than supply (more buyers than sellers), the stock will rise in price and vice versa. In strong and healthy bull markets you have far more buyers than sellers and so you see far more 52-week new highs than 52-week new lows. However, as investor capital is used up and there are fewer buyers around, eventually more and more sellers emerge so that you have an equal number of buyers and sellers, this is typically when the markets begin to slow and a top emerges. The Hindenburg Omen attempts to identify these periods when there is a balance between buyers and sellers seen during tops and why so many investors pay attention to it.
We started to see many signals last summer as investors were turning cautious, and a more recent example came in August of last year when trading desks were stirred up by the ominous warning, which only resulted in a mild pullback.
Throw together multiple Hindenburg Omens and yet another a 1987-style crash call from Marc Faber and what do you get? Market jitters. Last August I pushed back against Faber's crash call and explained why it was unlikely at the time (see story) and then also addressed why the Hindenburg Omens would likely not amount to much either (see story).
If you remember, last summer we saw a sharp spike in interest rates which later became known as the “taper tantrum” as markets began to anticipate the Fed slowing its asset purchases. The spike in interest rates sent the bond market reeling and many closed-end bond funds or interest-rate sensitive securities plummeted to new lows and were causing the spike in new 52-week lows on the NYSE to rise and helped to generate Hindenburg Omens. In my article I showed that 96% of the 52-week highs on the NYSE in the middle of August were common stocks while of the 52-week lows, closed-end funds made up 40% and of those 39% of them had a fixed-income focus and 80% of them had market caps under $50M.
In a follow-up article (click for link) I showed that when you apply the Hindenburg Omen requirements to stock-only indices you get far less signals and none of the major averages had a Hindenburg Omen signal in May nor in August of 2013. In fact, since the bull market began in March 2009, only one signal had been seen on the S&P 500 and that was on July 26th of 2012, which never resulted in a market correction.
This bull market has seen remarkably few Hindenburg Omens, even less than the 2003-2007 bull market. In 2003 there were no signals on the S&P 500, Russell 2000, or NASDAQ but there were a few in 2004 that led to pullbacks. There was one signal on the Russell 2000 in early 2005 that led to a ~ 12% pullback and then one in September on the S&P 500 that led to a 5% pullback. Both the Russell 2000 and the S&P 500 gave signals near the May 2006 top that led close to a 15% pullback on the Russell 2000 and then no signals were given for over a year. However, by the middle of 2007 Hindenburg Omens were nearly a daily event as seen below. A single Hindenburg Omen is shown by a yellow circle while subsequent Omens that occur within 30 days of the first signal are shown by the red diamonds. Given how well the cluster of Hindenburg Omens signaled the 2007 top it pays to listen up when a signal is given on the major indices that do not have fixed-income securities.
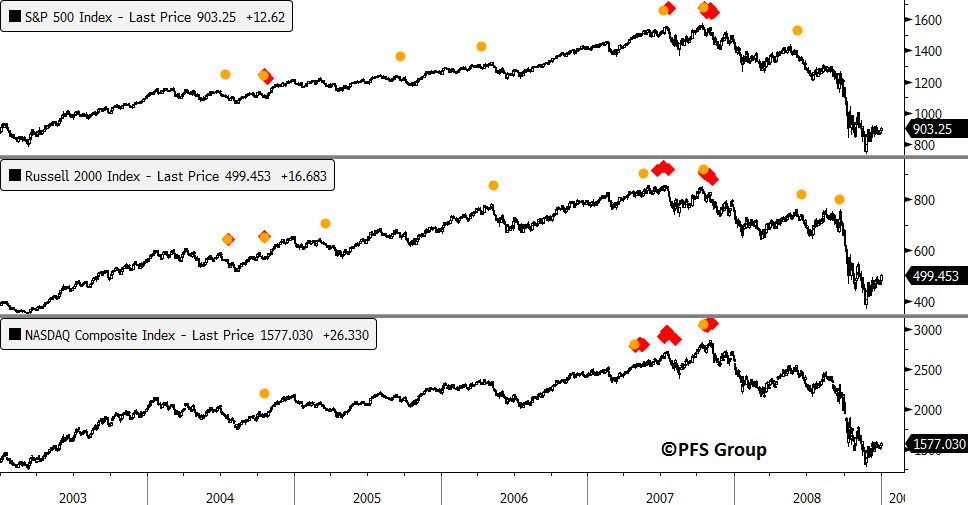
Source: Bloomberg
A look at Hindenburg Omens on the same indices for the current bull market is shown below and the track record for the signals is mixed. Throughout all of 2009 and most of 2010 the indices were devoid of any signals. We did get one on the NASDAQ on November 30, 2010, but that was a non-event. The next signal occurred on June 1, 2011 on the NASDAQ and that gave warning to an 8% pullback that month. The next signal occurred on the NASDAQ on April 16, 2012 and then a second signal occurred on May 3rd that warned of the 11% pullback during that month. The following signal was on the S&P 500 on July 26, 2012 that was a complete flop as the markets just continued marching higher. There weren’t any signals for a year and a half until the November 7, 2013 signal on the NASDAQ, however, that was also a flop. So from 2009 through 2013, we had 5 signals and 3 out of the 5 led to no pullback.

Source: Bloomberg
For much of 2014 the major indices have been devoid of Hindenburg Omens until just recently. We had two signals in the middle of September on the NASDAQ which warned of the coming ~ 11% pullback heading into October. The NASDAQ saw another signal on November 17th and the most recent signal came on the Russell 2000 on Black Friday, November 28th and was the first signal the Russell 2000 has seen since the bull market began.
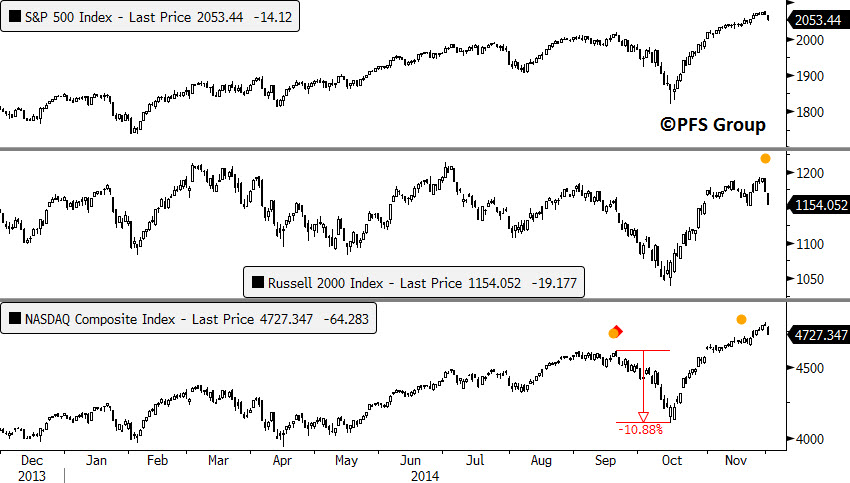
Source: Bloomberg
Since Friday the markets have softened with the S&P 500 falling just over 20 points, but given how extended the markets are and the near uninterrupted run since the mid-October lows, some backing and filling is likely in order and the recent Hindenburg Omen signals on the NASDAQ and Russell 2000 are likely warning of a coming pullback in the markets. Other indicators I track are also signaling this as well: equity put/call ratios are low as is the ARMS index and S&P 500 Skew spread and the one-month decline in the VIX is showing signs of investor complacency as everyone is expecting a Santa Claus year-end rally.
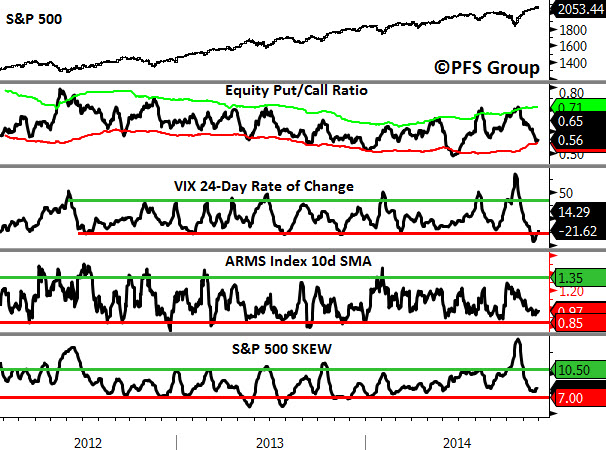
Source: Bloomberg
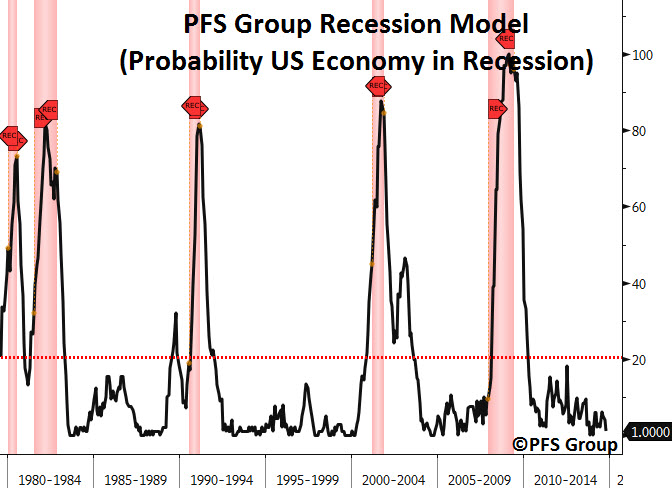
Given the solid economic backdrop however I wouldn’t expect any near-term weakness to morph into a deep correction. I track 18 leading economic indicators and so far in November, 100% of them remain in expansionary territory and more than half of them are accelerating from their October levels. Moreover, my recession model shows only a 1% chance the U.S. economy is in or nearing a recession.
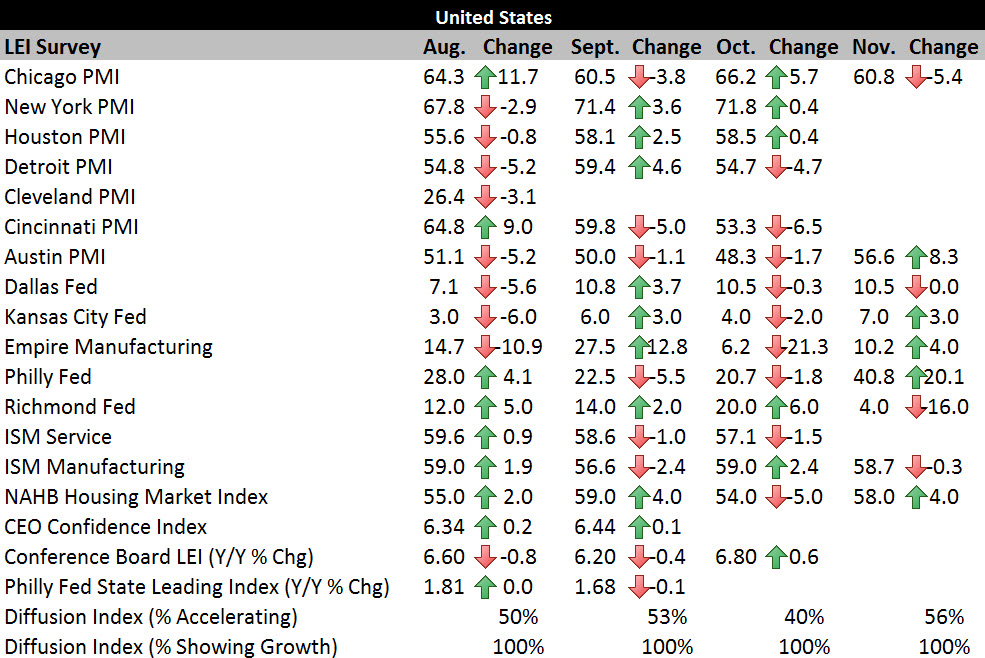
Source: Bloomberg
Source: Bloomberg
Conclusion
Investors are right to worry whenever they hear of a Hindenburg Omen as every major market decline has been preceded by the dark omen. However, there are many signals which led to only small market pullbacks or none at all so they should be taken with a grain of salt, particularly when applied to only the NYSE, which is riddled with fixed-income securities. When the signal is applied to stock-only indices the frequency of the signals goes down but their reliability improves.
When we see major clusters of signals a major top is likely approaching as was seen in 2007 on the S&P 500, Russell 2000, and the NASDAQ. This bull market has seen very few signals and the success rate of the signals is about the same as a coin toss. That said, they should still be taken seriously and whether the first signal for the Russell 2000 that just happened to occur on Black Friday carries any significance remains to be seen, but investors should be on alert for some near-term market weakness.


