


Fun with the Gold Bugs
It is an article of faith with Gold bugs that Gold is always supremely valuable; always a buy or near a buy and only ever goes down in price because of manipulation by the conspirators. According to the GATA Gold boosters, this market and its cousin Silver are the source of all wealth, immune to market forces, unaffected by such notions as liquidity and hedging strategies and truly worthy of a place in the pantheon of the gods.
These deep seated beliefs coupled with overindulgence at the websites and blogs of the like minded, eventually induce paranoia which takes the form of a siege mentality. All sorts of wishful thinking camouflaged as market lore are trotted out as pseudo buy signals to keep the hapless enthused. Long term moving averages and HUI correlations are hailed as potential buy signals. The clincher that price needs confirm the analysis is largely ignored. When faced with an objective comment that suggests Gold has any agenda other than a perpetual moon shot, the bugs morph into vigilantes who pour scorn and derision on the messenger. When the messenger continues to be right the vitriol bubbles over to personal abuse. You may recall my unsolicited nomination as “GATA moron of the year”.
The Danielcode was the only service to accurately call the March 17 high in Gold and did it to 2 ticks (see Prophesy! 03/20/08 in FSO archives). As such it was singled out for special treatment when the leading Gold newsletter published by the  prominent Gold vigilante attack dog, shown here on the warpath, featured my Gold article “RIP Goldrush!” (Financial Sense 03/28/08), in his very widely followed newsletter and heaped scorn and ridicule on my comments that “More troubling for Gold owners, the turn in Gold coincided with the turn in US Dollar Index which arrived at its long forecast Daniel number as Gold made its 1034 high on Monday 17 March. What was it that caused such a violent reaction in Gold and Silver to the apparently innocuous daily bar in DX on the 17th? If you followed the Danielcode you would know. This week Gold has confirmed its commodity status as a tool of the carry trade by mirror imaging DX in its meandering rally. If Gold truly is an independent market with its own drivers this should not happen to this degree although the hedge against USD is part of the trade.”
Last week Gold proved again that bluster, bluff and talking your trade are no substitute for the inalienable laws of price action as Comex Gold officially entered bear territory with its trade to 777.70 in the December contract, a fall of 6.20 from its March highs. Uh, that’s a fall of 24.77% guys and 20% down is the usually accepted definition of a bear market!
Not so silly now, is it? In fact all of the Danielcode articles calling the DX low and the Gold and Silver highs are proving to be remarkably prescient. None of this should be taken to mean that I am a Gold bear. I am completely agnostic on Gold as I am on all markets. “Neither be a bull or a bear” Mr Gann advised. My argument simply is now, as it was before the peak that markets fluctuate, sometimes violently, and prudent traders and investors need an exit or at least a stop loss strategy for those times when markets go against them.
There really is Manipulation Guys!
We have seen many times that all markets are manipulated. Why this should come as a surprise to some is a mystery. Sometimes this can be done by dominant players; sometimes by the effect of government policy (think Ethanol and Corn prices); sometimes by policy considerations. The Oil rally could have been shortened had NYMEX doubled or tripled the margins on futures contracts as most would have thought prudent. That course was not contemplated seriously by regulators as it would have led to trading volume moving to other exchanges and perhaps other currencies. The business model apparently has priority over the public good! Before brokers start bellowing about not moving the goal posts and maintaining confidence in the market, recall that there is no problem in increasing margins in falling markets or changing the rules midstream to forestall short selling. Direct market manipulation in equity and debt markets by the Fed’s overnight changes in policy settings is now just another fact of life.
This month’s manipulation of the US Dollar index has brought little complaint. but has validated a constant GATA theme. But not in the way that our enthusiastic protagonists thought! Unfortunately for those espousing the Gold conspiracy cause, markets have proven the exact opposite of their contextual belief.. Followers of the curiously dormant GATA Gold conspiracy campaign will recall the fuss about their notorious advertisement in the Wall Street Journal in January 2008. The ad which according to a GATA release cost about 6K made startling allegations which go to the heart of the conspiratorial belief:
The GATA ad charged that “the U.S. government surreptitiously utilizes gold reserves to engage in international swaps and other market manipulations. The ad stated that the objective of this manipulation is to conceal the mismanagement of the U.S. dollar so that it might retain its function as the world's reserve currency.”
Since the beginning of this month, US government has indeed engaged in some serious market manipulation with a full court press on the US Dollar which took DX into the pain zone for those who don’t follow the Danielcode and were therefore ignorant that DX had make at least an intermediate bottom near 70.40 as forecast in Financial Sense in February.
US Dollar Index
With a stoic belief in the one way ticket to doom trumpeted by almost all others, ranging from business gurus to fashion models, it was only necessary to push the rally into the stops and the forced short covering did the rest!

The real rationale for this fairly obvious maneuver is the concentration of GSE debt in Asian hands and the need for ongoing purchases by these traditional buyers. Reuters reports: An extraordinary Treasury capital infusion may be needed to restore faltering foreign demand for debt issued by Fannie Mae and Freddie Mac, the two top home funding sources that the government is willing to rescue to save the housing market. The companies rely heavily on overseas investment, often up to two-thirds of each new multibillion-dollar note offering.
But foreign central banks have dumped nearly billion from their record holdings of this debt in four weeks, to 5 billion, and won't return in force before it's clear if -- and how -- the government will back Fannie and Freddie. The bonds these companies issue in the .5 trillion agency MBS market are near or worse than the weakest levels, set in March before the government engineered the sale of failing Bear Stearns to JPMorgan.
The corollary is that nervous buyers are not going to be coaxed back to the auction floor without some assurance that the diminishing dollar dive is being abated. And yes, it is a big deal. The top four foreign holders of Freddie and Fannie long-term debt are China, Japan, the Cayman Islands and the other tax haven, Luxembourg. In total, foreign investors hold over .3 trillion in these agency bonds, according to the U.S. Treasury's most recent "Report on Foreign Portfolio Holdings of U.S. Securities."
Gold, Silver and HUI
Dollar bears and Gold bulls were led by the nose and slaughtered.

The rout eventually abated 3 points from Daniel number support at 777.70. We had talked earlier about the importance of the black DC number at 802 and we did indeed get a weekly close below that number which implies that lower prices lie ahead.
If we look at the monthly binomial chart of Comex Gold we should see a number of interesting and unique features that give us some insights into this market. For those who are not familiar with these charts. we use a computer model to draw the standard Daniel ratios derived from market prices, but instead of being horizontal lines as we commonly display, these are drawn on the arc. On this weekly binomial chart you can see that the binomials work as a dynamic overbought/oversold model as well as providing trading signals. A simple observation would show that this market doesn’t close outside the binomials often. When it does a reaction usually ensues. We saw from last week’s price action that the binomials identified this market as very oversold and we expected a rally for this week at least.

Whilst Gold is down 25% from its March highs, for Silver and HUI, the losses have been much worse. Comex Silver traded down to its Danielcode support at 1220.0. The black line in the DC retracement sequence is the last level of Daniel number support for the operative swing. 1220.00 has been on subscribers charts for weeks. Last week’s low was 1220.0. Did you know? DC members did.
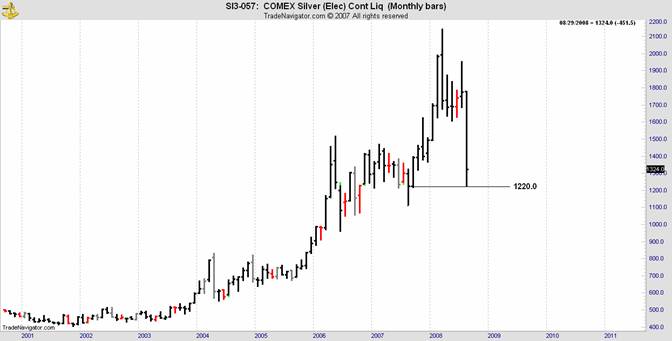
Silver gave up 43% from its March highs to get to last week’s lows. Does “buy and hold” look like a good strategy now? If you bought Silver or the HUI index any time after early 2006 you haven’t even made the carrying cost. My broker friend in the West (Perth), reported today that Australian junior miners were “flat lining.” I did not ask whether he meant their price was going sideways or their corporate hearts had stopped beating. I suspect the latter.
The HUI index below, is also down to early 2006 levels and 40% off its March highs. It too found its Daniel sequence number with eerie precision. How is it that these markets know these secret price levels?
Image cannot be displayed
For HUI index and Comex Silver, the challenge now is to hold the DC black line support. A weekly close below those numbers will confirm Gold’s precarious chart position and signal lower prices ahead.
For bulls, the DC black lines are the strongest support and whilst the Gold, Silver and HUI charts appear different and have markedly different loss percentages, the Danielcode sequence tells us that they are virtually in the same position. Gold has broken its DC black line but bounced off the next DC number to rapidly recover the critical price level. Silver and HUI have found the last level of Danielcode support for the major swing, to the tick. These markets know precisely where their DC numbers are and we have many instances where precipitous falls have turned exactly at these price levels.
This phenomenon happens in all markets. Here is an historic DC call in forex from 26th March 2006.
Image cannot be displayed
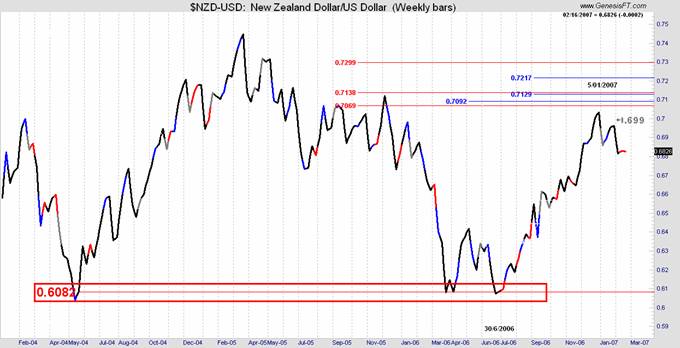
The important notation is “Last level of Danielcode support for $NZD-USD”. The closing price for the last weekly bar on the chart was 0.6080 (60.80) and the date was Friday 24th March 2006. The “Last level of Danielcode support” highlighted on the chart with a red rectangle was 60.82, just 2/100ths from the weekly close.
If you look at today’s chart which shows subsequent price action, you will think that the DC final support level in 2006 was a pretty good call. You can also see how this market right now is acknowledging its own DC black line on the current major swing.
Image cannot be displayed
If you look at the same chart on a “Close Only” basis you will think it miraculous. It caught the impulse low and the two subsequent retests all within 2/1000ths basis this cash chart.
This is the same low that Export NZ said “nobody predicted” as the majority of NZ corporates didn’t see the turn and remained unhedged into the historic rally that ensued. For many that was a fatal omission!
The message for traders and investors is that price action is the ultimate truth in markets. We can never know what markets have in store, but we can measures and define the signals that will turn markets.
A rational and consistent process based on observed price action always beats wishing and hoping.
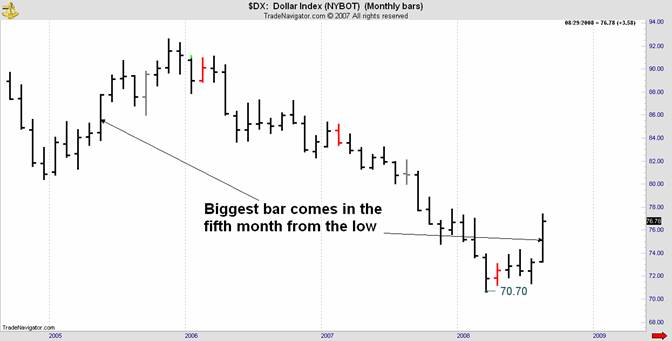
As a final reminder of how entrenched the dead Dollar trade had become, it took Goldman Sachs’ elite markets team until last weekend to issue an alert that "The Dollar Has Bottomed!”. You of course knew this was a likely outcome from my Financial Sense articles as early as February when the Daniel number sequence called for 70.40 to be at least an intermediate bottom in DX.
As an amusing piece of market trivia that will resonate with only the truly obsessed chartists, note how the explosion in DX came in the fifth month from the low which rhymed with the last multi month rally in 2005.
For those who want to know where markets turn, I invite you to visit the Danielcode website to learn more about how the Daniel number sequence called the highs in Gold and Silver to a few ticks and foreshadowed the low in DX weeks before it happened. Those insights were revealed exclusively to my subscribers in real time and to Financial Sense readers.
This indeed was uncommon news for those who knew. Perhaps this knowledge on a timely basis would have assisted you. Much of this information is available free to FSO readers. More is available to subscribers who have the DC numbers posted well in advance of market moves. Perhaps it is time for you to learn where these secret price levels that markets know but others do not see, will lie in the future.
The binomial Gold Trend Charts, free for Financial Sense readers are on the front page of the DC website and are updated before the US open on Mondays. They provide a step by step process that creates weekly and monthly chart signals in Comex Gold and HUI. These particular charts are more suited to investors than traders who will want the shorter term charts, but even a cursory study of the monthly charts would endow you with more knowledge than most.
Copyright © 2008 John Needham


