


With the first quarter of 2016 now in the books, the focus turns to earnings. So far the picture is not looking very pretty.
Earnings for S&P 500 companies are estimated to decline 8.5% (FactSet). If negative earnings growth comes to fruition, it will mark the fourth consecutive quarter of year-over-year earnings declines. The last time that happened was during the financial crisis.
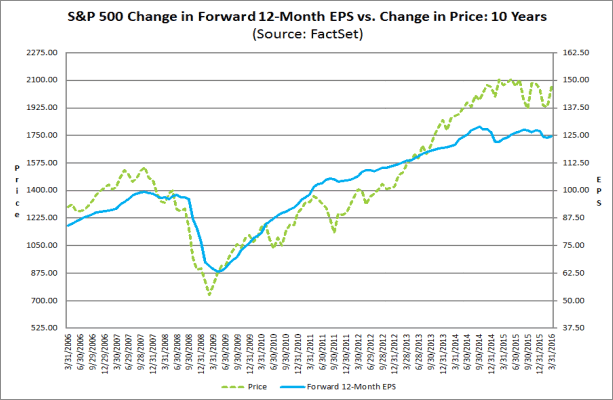
The chart below shows the tough environment that corporate earnings find themselves in. When you consider that stock prices track corporate earnings over the long-run, it should come as no surprise that stocks have been turbulent lately.
Much of this, as you know, comes down to the influence of two major components of the global economy: the strength of the almighty dollar, and the price of oil. We’re going to ignore oil for today.
I’ve droned on and on about the dollar over the past couple of years, but that’s because it’s been the most prominent bogey to the US economy.
Many people don’t realize that when they invest in the S&P 500, they’re actually getting a significant amount of international exposure. The chart below shows a breakdown of S&P 500 revenues by region, and as you can see, a significant portion comes from outside the US
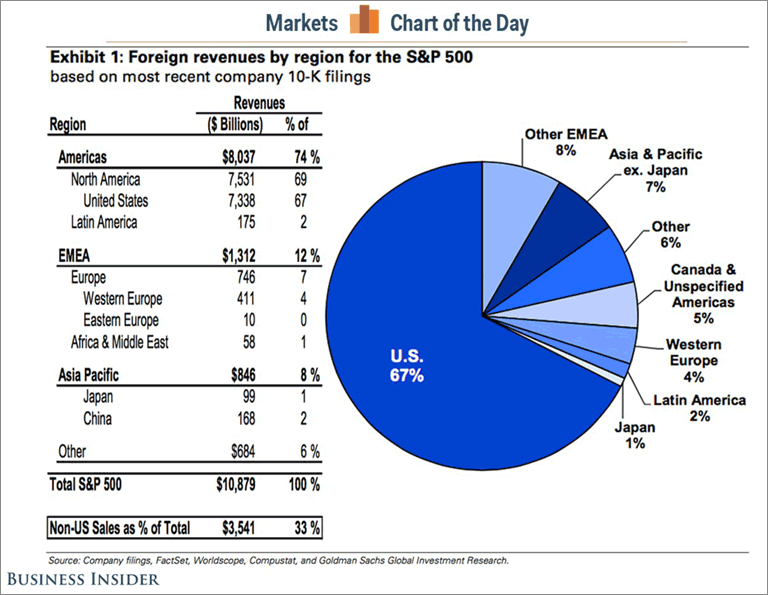
These figures are from 2014 … 2015 figures have yet to be compiled, but you can assume the numbers are quite similar. In addition, this chart may understate the percentage of revenues coming from outside the US (33%) as a similar analysis done by S&P Dow Jones Indices suggests that figure is closer to 48%. (The discrepancy comes from the fact that assumptions need to be made since there is no standard methodology for companies to report sales by region or country.)
Regardless, the point is clear. Our biggest and baddest companies rely on overseas revenue as a major engine of growth, and the dollar’s exchange rate is the transmission mechanism for bringing those revenues and profits home.
In the first chart presented, notice that expected corporate profit growth began to stall right at the end of Q3 2014. This coincides within a month or two of the dollar beginning its massive ascent. That point marked the beginning of lower estimated and actual earnings-per-share, which continues to characterize our current environment.
Read Former Multi-Billion Dollar Hedge Fund Manager Warns on US Stock Market, Economy
The manufacturing side of our economy has more international exposure than the services sector, and declines in manufacturing have led some to call this a “manufacturing recession.” With the ISM (Institute of Supply Management) figures deteriorating over the last two years, it’s hard to argue with that statement. As the dollar rose, it priced many US made products out of international markets.
But lately the trend of the dollar has been weakening, and this has helped spur a revival in the manufacturing sector of our economy.
In the chart below you can see this playing out. After declining severely for over a year-and-a-half, and spending a few months in contractionary territory (below the 50-line), the ISM Manufacturing Index, and particularly the New Orders component, have shifted back into expansionary mode.

This is a great signal and adds credence to the sustainability of the current stock market rally. However, be aware that much of this behavior continues to be dollar driven.
The Dollar Index, shown below, helps provide context to what we’re seeing in the ISM figures above. Notice that the dollar hit a recent peak in late 2015 (black circle) as both the ISM and the New Orders component bottomed, and has since been heading lower.

The dollar still remains very strong compared to a couple of years ago, but this recent downtrend has eased pressure on international revenues and is a big reason why we’re seeing an uptick in the manufacturing side of our economy.
So … what’s next?
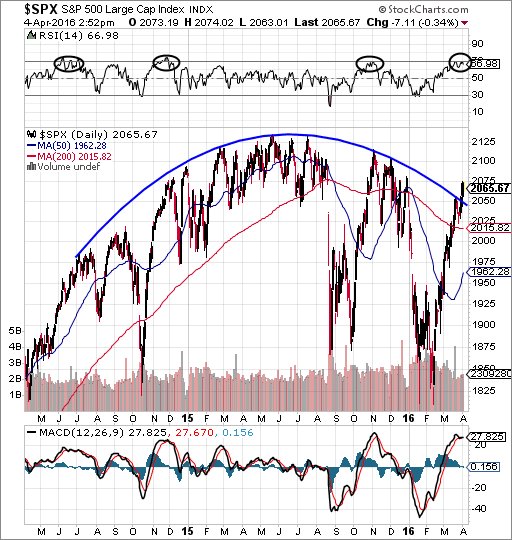
The six-week rally that we find ourselves in has given way to a few interesting developments. First, by not providing any type of meaningful correction, this rally has refused to provide a pattern of higher lows and higher highs – the telltale signal of a bullish trend.
Read also S&P 500 Getting Stretched - Topping Process Likely Underway
Instead, it’s been a one-way momentum push higher that’s resulted in the most recent low being the lowest-low we’ve seen in quite some time, while the most recent high (back at the end of February) was obliterated as the market soared higher.
If that doesn’t make you scratch your head, then consider these bullish and bearish factoids as well:
- Bullish: The large multi-year rounding-top formation that has been in place for years now appears to be broken.
- Bearish: The S&P is overbought (rightmost black circle) and historically, this has led to sharp drops in the index (see previous black circles).
- Bearish: The MACD line has come way off its lows and appears to be rolling over again as the signal line loses its upward momentum.
Finally, one more item to add to the bullish side is market breadth. Below you can see that participation in this rally has been very strong with the NYSE A-D line soaring all the way back up to its previous highs.

If the A-D line fails to break out above its prior high, that could be construed as bearish; but nonetheless, it is evident that this latest rally is for real.
Therefore, it would seem that a reasonable course of action would be to hold on to existing positions, but be wary of adding to those positions until we experience a meaningful correction. On the other hand, if you’re still convinced that the economy is about to crash and we’re heading back into GFC 2.0, then this would make a fantastic exit point for any remaining positions you have been trying to liquidate.
You may also like Markets Facing "Global Overhang of Draining Liquidity," Says Expert
Above all … keep watching the dollar for your cues.
The preceding content was an excerpt from Dow Theory Letters. To receive their daily updates and research, click here to subscribe.


