


The following is an excerpt from Richard Russell's Dow Theory Letters
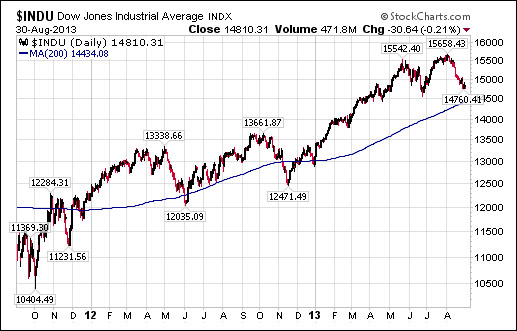
My key indicator is seen below. Here we see the Dow holding persistently and bullishly above its 200-day moving average. How long will this constructive situation last? Ah, if we only knew (I think it will be quite a while).
According to this week's Barron's, the majority of leading advisors are bullish on the stock market. But I don't operate on the basis of what the majority of analysts believe. I always put the price action in the market first on my list of what to believe.
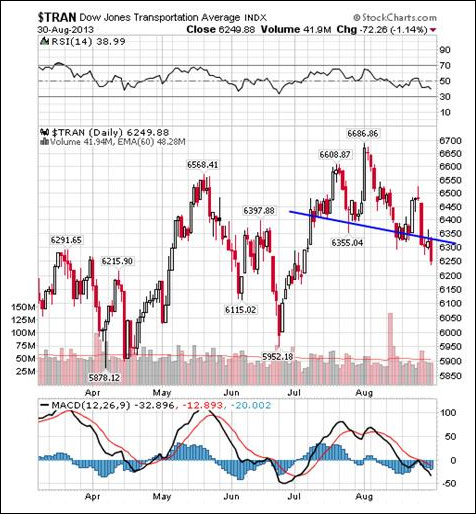
And below, we have an interesting situation. The D-J Transportation Average is in a head-and-shoulders pattern which has broken down.
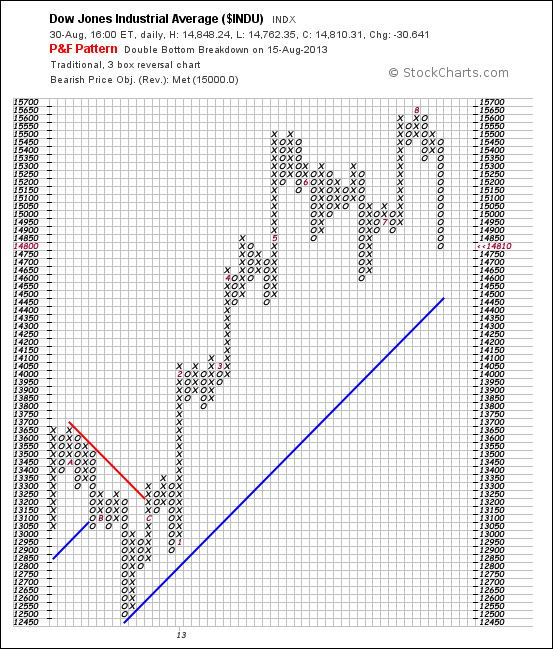
Below, we see that the Dow is not confirming the weakness in the Transports. With the Dow refusing to break down and refusing to confirm the weakness in the Transports, the market should be ready to rally.

An interesting part of the picture is the P&F chart for the Dow. The Dow formed a consolidation formation with a low at the 15,350 box. Next, we saw a little three-box advance, and then a downside reversal which broke below 15,350. The Dow has now surpassed its downside price target and appears to have halted at the 14,800 box. This is well above the rising blue trendline. The decline has been extreme in that it has traveled past its downside target. My guess is that the next move of the Dow will be to retrace part or all of its most recent decline.
Overall conclusion -- the main trend remains bullish.
Below we see the US Dollar Index. It formed a triple-top at the 84 box, and then turned down to test the 81 box. A breakout to 85 would be very bullish for the dollar and its international financial standing.

The long maturity end of the Treasury market is running into trouble. This is the part of the bond market that the Fed does not control. On its most recent decline, the long bond broke below its rising trendline. Long interest rates are therefore rising, and thus impacting housing.

The bellwether yield on the 10-year Treasury is starting to surge. Below we see the yield climbing to a new high of 2.90%. Will this halt the stock market's climb? It hasn't yet, but it will be murder on the housing industry.

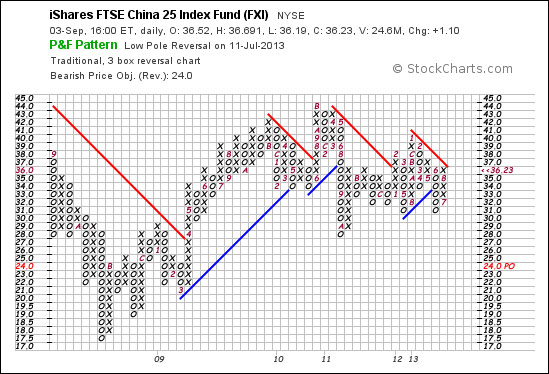
China, below, has formed a tight consolidation pattern and could go either way. A rally to the 40 box would be bullish for China and probably the rest of the world. A decline to the 30 box would be bearish for the land of the dragon.
The Utilities, which nobody watches, have bothered me. The P&F chart is bearish with a price target of 429. Of course, the Utilities are affected by rising interest rates.

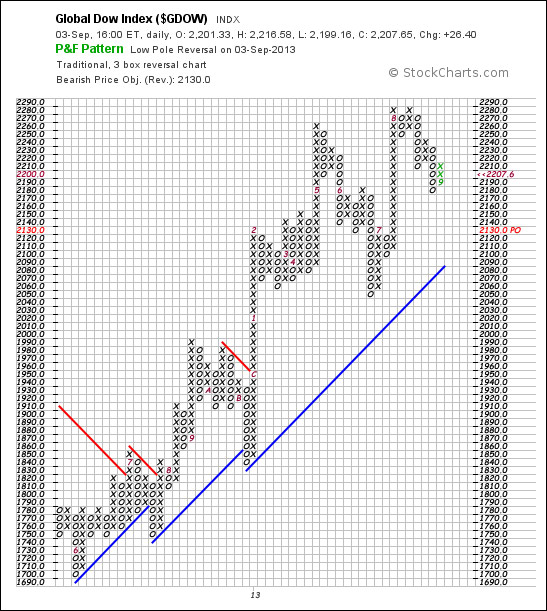
Below, the GDOW. It tells us how the world is doing. Looking at the chart, first we got a sell signal, but immediately afterwards we saw a three-box rally. Conclusion -- neutral.
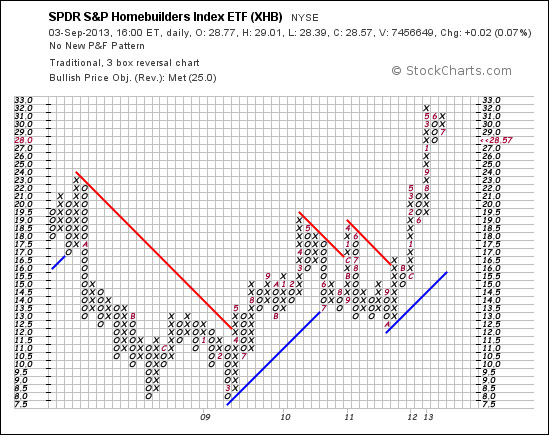
OK, let's look at housing. So far, it looks bullish. A rise to the 33 box would be very bullish while a decline on the P&F chart to 27 would be bearish for housing. These little consolidations usually break out in the direction from which they came (which in this case is up).
To read the rest of Richard Russell’s Dow Theory Letters and receive daily updates, click here to subscribe.


