


As I’ve been hearing the pushback to the market’s gains, there are a few that are louder than the rest. I guess if you say something enough times, it becomes truth. Unfortunately for the general population, not many investors are savvy enough to do their own statistical analysis nor do they have the databases and subscriptions to expensive services to view 10 to 20 years of data. J.P. Morgan released their treasure trove of market insight with their Q2 Guide to the Markets last week. I’m going to highlight a few of their slides because they argue against many of the opinions voiced by the bull market naysayers and echo some of the points I have made last quarter. The Guide to the Markets is a treasure trove to the financial geek and I highly recommend savvy investors and investment professionals review it.
A list of criticisms concerning the bull market is as follows:
Fundamental Pushback
- Stocks are overvalued
- Stocks are up because of the Fed
- Earnings are growing only because of buybacks
- Stocks are in a bubble
Technical Pushback
- Stocks need a 10% correction (some say 30%)
- Stocks are overbought
- Not enough participation
I’m not going to comment on the technical pushback, maybe at a later date, but rather the fundamental pushback using J.P. Morgan’s Guide to the Markets. I want to focus on four slides which, by themselves, argue against three of the four points concerning stock valuations and whether we’re in a mania. These points drive home some of the points I made on the webinar last quarter. The first to discuss is valuations and price-to-earnings (P/E) multiples. Note that I’ll be discussing a lot of statistics, so bear with me and I will summarize the main points at the end.
The first point I want to address is the criticism over earnings boosted by stock buybacks because the rest of my argument is focused on valuations based on earnings. J.P. Morgan’s 9th slide shows that earnings growth has been as a result of mainly revenue growth and margin expansion – not stock buybacks. The chart makes a lot of sense.

As the economy decelerates, margins sink as sellers need to discount goods and services. When it is clear there is a recession or mid-cycle slowdown, companies cut costs to create efficiencies. When activity picks up, companies are lean and they’re able to increase prices again, margins expand along with revenue. Not all companies buy back their shares. Many issue shares to make long-term investments and many companies make initial public offerings. In the recent first quarter of 2014, companies issued more shares than were taken off the market.
Slide 7 (below) shows a table of various valuation measures and their historical averages using 1, 5, 10, and 25-year averages. Many of these measures are above their recent historical average, but near their long-term average. We’ve had two crisis recently: the 2008 Financial Crisis and the 2012 European Sovereign Debt Crisis. Both have depressed valuations and do not reflect what a healthy market should look like. The more meaningful average by which to judge the market is the long-term average which spans across two bull markets and two bear markets. As I have said in the webinar and on the radio, we are at “fair” valuations near the 25-year historical averages for the various valuation measures; and I’m looking for multiples to rise in the years ahead as the bull matures.
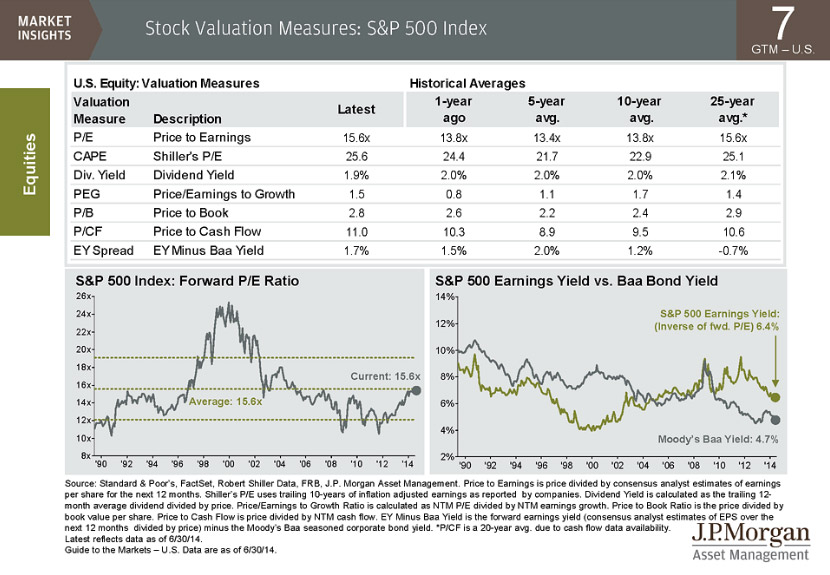
Below the valuation measures table are two charts showing the forward P/E and, secondly, the S&P 500 earnings yield compared to Moody’s Baa seasoned corporate bond yield. We are currently right at the long-term average for the forward P/E at 15.6 times earnings after bottoming at the end of 2011 during the European Sovereign Debt Crisis (soon after Mario Draghi’s first LTRO announcement). Note that overall, the S&P 500 Index forward P/E ratio tends to trend and will turn as slow as a battleship. P/E multiples expand, contract, and oscillate. It appears we have broken the P/E multiple contraction period from 2000 to 2012 and have only just begun a new upward trend. This is another reason, beyond the new all-time highs for leading market indices, why I believe we are in a new secular bull market.
The earnings yield (inverse of the forward P/E) gap to Moody’s Baa seasoned corporate bond yield also iterates that there’s more bang for your buck in stocks over corporate bonds. Do I want to be an owner of companies or a lender to companies? Answer: An owner, based on the yields and spread between the two; however, that gap has narrowed over the last two years. If the economy finally picks up due to the wealth effect (we certainly see it in San Diego) and due to an environment of stable financial markets, then we might see the earnings yield go up.
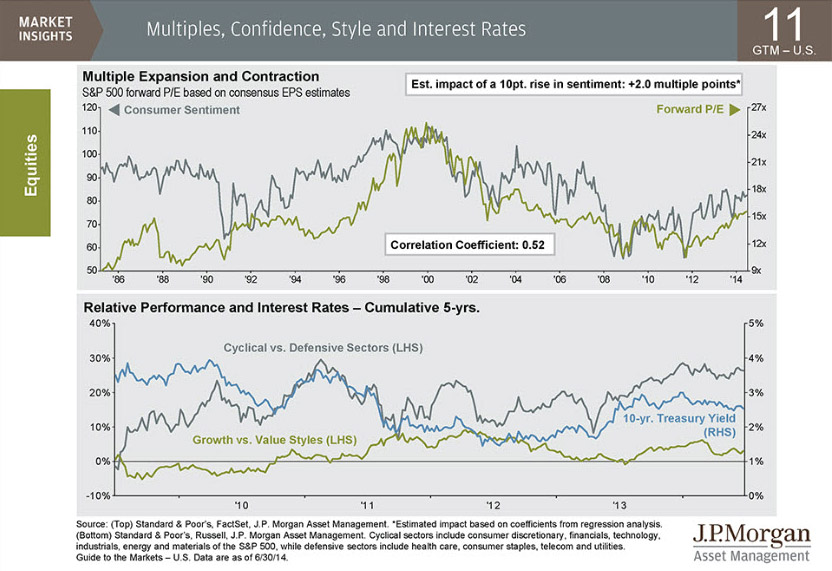
As I mentioned, P/E multiples tend to trend. Here’s a chart on Slide 11 that shows the relationship between the S&P 500’s forward P/E based on consensus EPS estimates and the Consumer Sentiment Index. Note the close resemblance between the two. J.P. Morgan estimated that a 10-point rise in sentiment adds 2.0 multiple points based on coefficients from regression analysis. Both consumer sentiment and P/E multiples have been in decline since 2000 and both bottomed at the end of 2011. Can a market be a bubble if valuations and consumer sentiment have only just bottomed a year and a half ago? Bull markets tend to last more than just a year and a half. Cyclical markets last on average 4-years. The last P/E and sentiment expansion was from 1991 to 2000 — 9 years.
Are we at a market top and are stocks in a bubble? Here’s another slide to discuss on that note. Slide 61 shows mutual fund flows, something I have talked about for years over and over since the market bottom in 2009. Investors are not overly allocated into stocks. Investors have been deleveraging from stocks since 2006 and have only just begun to believe in this market with net positive fund flows into domestic equities in 2013. Contrarian investors believe if there’s nobody left to buy something, how can it keep going up? This clearly shows there’s plenty of investors still left to buy this market, especially if they sell all of the bond funds in a rising interest rate environment they just bought over the last five years. There’s .5 trillion in cash according to the Investment Company Institute (ICI). That’s a lot of assets not earning anything, sitting on the sidelines.
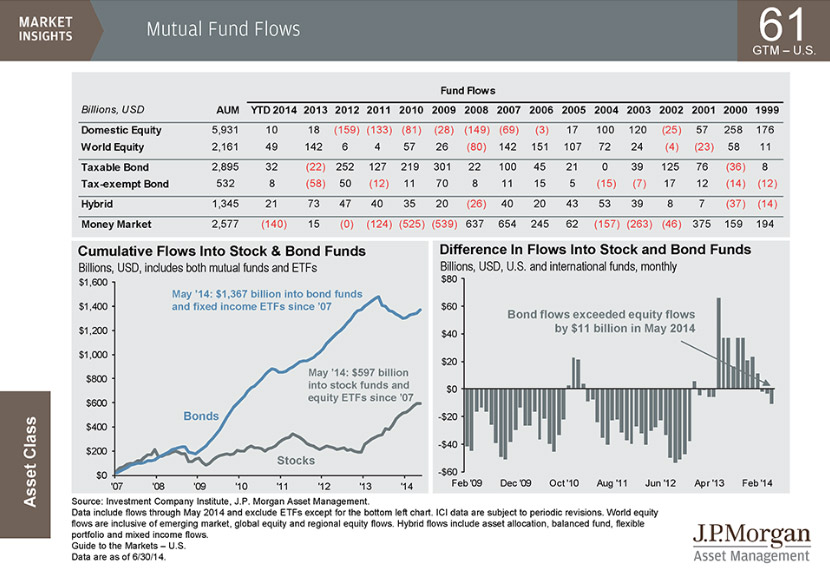
“Stock investors are complacent” is a complaint I have been hearing lately. The only complacency I see is the belief that rates will remain low. Investors have been piling into the fixed income market after the last bear market, as shown by the cumulative flows into bond funds on Slide 61, because boomers have had their retirement shocked by two bear markets.
The chart to the bottom right (above) showing the difference between flows into stocks and bonds indicates that it wasn’t until Bernanke scared investors last year that investors started to wake up to the idea that rates will not be low forever when the 10-year Treasury yield spiked from 1.5 percent to almost 3 percent. If there’s any bubble in the market, it’s the risk-taking and search for yield I see in long-term bond investments that use leverage to maximize returns. Do you know if your bond fund uses leverage to get you high yields?
Summary
There have been many fundamental criticisms of the bull market, and the main one this year has been valuations are too high, and that earnings per share growth is frothy due to stock buybacks. I’ve used some of the slides from J.P. Morgan’s Guide to the Markets to show this isn’t the case based on facts. P/E expansion should not be something that’s feared one and a half years after multiples bottomed. They tend to trend in the direction of consumer sentiment on the economy. If consumers are shocked by inflation, oil prices, a war, or another financial crisis we would expect sentiment to fall as well as multiples; however, the trend is up and therefore our bias needs to be bullish — not doom and gloom.


