


What we are witnessing here is the disintegration of the so-called economic recovery. A great deal of effort by the fed to print, pump and prime the market seems to be losing steam. The tide has now changed as the broader stock markets decline; the precious metals have decoupled moving higher making significant gains.
The once great U.S. economy is nothing more than a grand paper facade. The housing market is not being kept alive by mom & pop home buyers, but rather from a mixture of wealthy individuals, hedge funds and Wall Street who are buying up real estate with cash. Real estate speculators are the most fickle of the bunch.
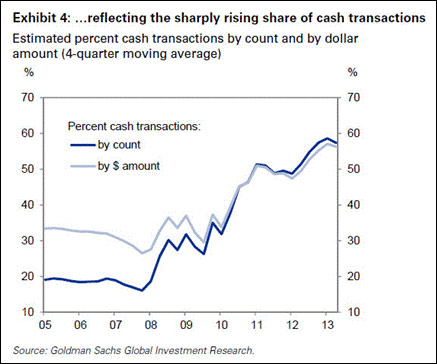
If we look at the chart below, we can see that the majority of home purchases have been using cash:
According to Dr. Housing Bubble:
I think the myth of cash buyers being a small part of the market fed into the meme that the housing market was “organically” going up on the underlying power of the economy. In reality, the market has been bubbling up because hot money is voraciously fighting over itself to eat up whatever inventory is available.
The above chart clearly shows that investor money is really driving the bulk of the housing market. The low rates promoted by the Fed were cast under the umbrella of helping out regular families but in reality, they have turned into the next hot money play for banks, hedge funds, and Wall Street. The fact that 60 percent of all purchases in 2013 are being driven by the cash crowd is crazy (a 200 percent increase from the 20 percent pre-crash levels).
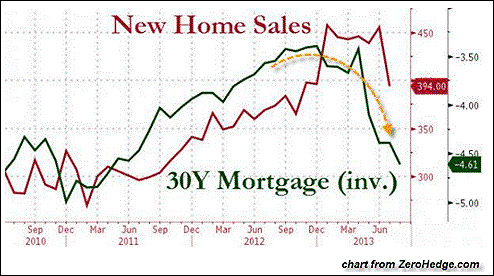
Furthermore, it looks like the housing market is starting to turn south as new home sales missed big time:
And lastly, we know we are getting into serious bubble territory when the largest Wall Street Firms are unloading some of their real estate exposure by the selling of rental backed securities.
The last time there was a great divergence (to the benefit of housing), Wall Street spawned an entire Residential Mortgage-Backed Securities industry where Paulson, Goldman willing sellers would package mortgages, often-times synthetically, slice them up in tranches of assorted riskiness, and sell them to willing idiots yield-starved buyers. As everyone knows, that particular securitization bubble ended with the bankruptcy of Lehman, the bailout of AIG and the near collapse of the financial system. As it turns out, the answer to our original question was "a few hours" because securitizations are back, baby, and this time they are scarier and riskier than ever.
Blackstone - America's largest landlord - is now actively selling its housing exposure, whether with the assistance of Goldman's Fab Tourre, Paulson's Paolo Pellegrini, or... Deutsche Bank's own Greg Lippmann.
So, now that it looks like we have reached the top of the housing-rental market, the big players are getting out by packaging garbage and selling it to poor unworthy slobs. Not only are these big players selling at the top, they will more than likely be shorting these RBS- Rental Backed Securities all way down to the bottom.
Funny how markets never seem to learn from past mistakes.
The Great Precious Metal Divergence
A few months ago, I wrote about the great Dow Jones divergence after QE3 when the broader stock markets rose to new highs, while the precious metals were taken out to the woodshed and beaten senselessly.
Well, it looks as if the trend has changed as gold and silver have seemingly decoupled from the broader stock markets:
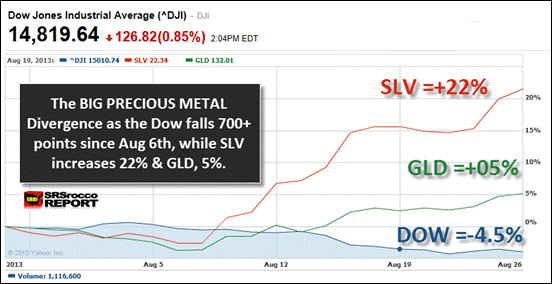
Since Aug. 6th, the price of gold and silver has moved up higher while the Dow Jones lost 700 points (chart above from 8/27). As we can see the SLV is outperforming the GLD. This is normally the case when we see the beginning stages of a new precious metal up-leg.
While the precious metals have fallen in Thursday trading, nothing goes up in a straight line. Furthermore, the action in the markets reconfirms this inverse precious metal-Dow Jones correlation.
There still seems to be many precious metal investors concerned with the so-called "supply & demand forces" in silver. Some may think that a slowing economy is bad for silver industrial demand. While that may have been true in the past, we are heading into a future in which orthodox forecasts become increasingly worthless. This will be a time when typical supply and demand analysis will be thrown out the window.
[Hear More: Ronald Stoeferle: We Were Really Close To A Default In The Leveraged Paper Gold System]
Gold and silver are now in the beginning stages of reclaiming their "monetary status." This can be easily seen by the two side-by-side charts below:
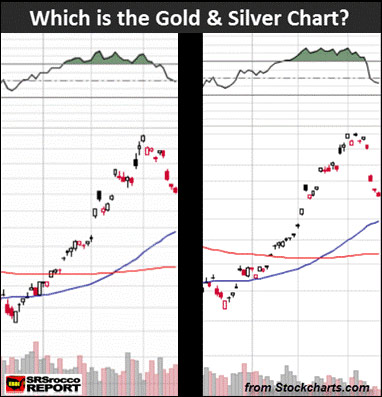
Without going to StockCharts.com and comparing charts, which chart belongs to gold and which to silver? Almost identical... aye? These are sections of gold & silver divided by the Dow Jones Average. The low point on both charts was in Nov. 2012 when the ratio of the Dow to gold & silver bottomed (Dow-Gold = 7/1, Dow-Silver = 375/1).
The top was reached in July 2013 when the Dow-Gold ratio hit 12.5/1 and the Dow-Silver ratio was a staggering 800/1. Today, the ratios have fallen considerably as it only takes 10.5 ounces of gold to buy the Dow and 610 ounces of silver.
As for the answer.... the gold chart is on the left and silver on the right.
The U.S. Economy's Best Days Are Behind It
There is still a great deal of optimism coming from MSM as well as some of the precious metal analysts that the U.S. can return to the heydays of the past and become a strong manufacturing economy once again.
I am really surprised that a few of the well-known gold bugs believe that once the U.S. dollar is backed by gold or etc, we will see one of the greatest economic expansions in U.S. history. I hate to break the bad news... but those days are over for good.
U.S. energy consumption peaked in 2007, and has been falling ever since.
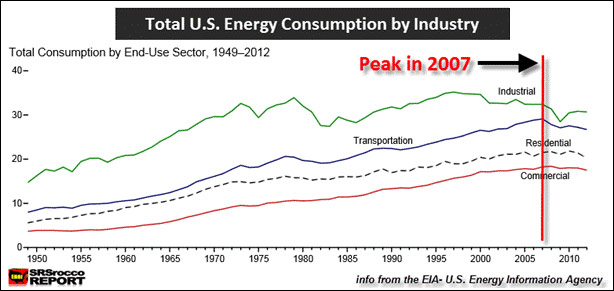
There are several trends that can be seen from the chart above. First, energy consumption in the transportation, residential and commercial sectors peaked during 2007-2008. Second, energy consumption in the great U.S. manufacturing sector first peaked in 1979 (shown by industrial consumption line) and then again in 1997. Third, the second peak in industrial energy consumption (1997) was the final nail in the coffin for the U.S. manufacturing industry as it was sent overseas to make way for the bubble service economy.
The reason why we cannot return to a manufacturing industry as we had in the past is due to the fact that we don't have the cheap and available energy to do so. Of course we can transition back to a more local and smaller mode of manufacturing in the states, but it will be a fraction of its former self.
The U.S. economy has been nothing more than a series of bubbles ever since it transitioned out of manufacturing and into a service economy. We now are at the very last and largest bubble in history -- the U.S. treasury bubble.
There is no way of telling exactly when the U.S. treasury bubble will burst, however fundamentals are now pointing back in favor of the precious metals. Currently we are seeing a decoupling as the prices of gold and silver are heading in the opposite direction of the broader stock markets.
Lastly, it looks as if the bullion banks are now situated to be on the "bullish side" of the big move up in the precious metals. With war on the horizon in Syria and the continued disintegration of the U.S. economy... things are about to get very interesting in the gold and silver markets.
[Listen: Brian Pretti: A Melt-Up in Stocks Is a Distinct Possibility]
Reminder... I will be posting average break-even for the top 12 silver miners next week, the beginning of Sept at the SRSrocco Report.


