


Summary
- The FOMC meets Dec. 19 for the final time in 2018
- While a rate hike is expected, whether the Fed will pause or not is being intensely debated
- Regardless of a pause or not, the Fed may have raised too many times already
- Interest-rate sensitive industries are taking a beating, supporting the notion the Fed has gone too far
- Slowing global liquidity and economic growth is a growing concern for 2019
Next week’s Federal Open Market Committee (FOMC) meeting outcome will likely end the market’s consolidation over the last two months. If the Fed turns a deaf ear to the market and does not signal a pause in rate hikes, we are likely to see markets in the U.S. and globally continue to sell off and break down to new lows. However, if the Fed finally acknowledges the material slowdown underway in interest-rate sensitive sectors, like housing and autos, and signals a pause we will likely be treated to a sell off in the USD and a rally in risk assets over the coming weeks. Even if the Fed does halt its rate hiking campaign it may have already raised rates too high when looking at how much tightening has taken place compared with prior cycles.
The trend in tighter monetary policy is not solely a U.S. phenomenon as global M2 money supply is contracting as well, weighing on risk assets all over the globe. We are also seeing an erosion in global economic growth momentum and that taken in conjunction with slowing global liquidity is not a recipe for strong risk asset performance. Consequently, investors may want to position themselves defensively heading into what is likely to be a very volatile 2019.
One of the biggest FOMC meetings of the year is ahead in which the Fed will decide whether or not to raise rates. According to Bloomberg, currently the market is pricing in a 74.8 percent chance of a hike next week and a 25.2 percent chance of no rate increase. The Fed often raises interest rates until something breaks, whether it be a break in the financial markets with some financial event or a break in the economy in which a recession occurs. A list of casualties from past Fed rate hikes is shown below going back to the 1970s.
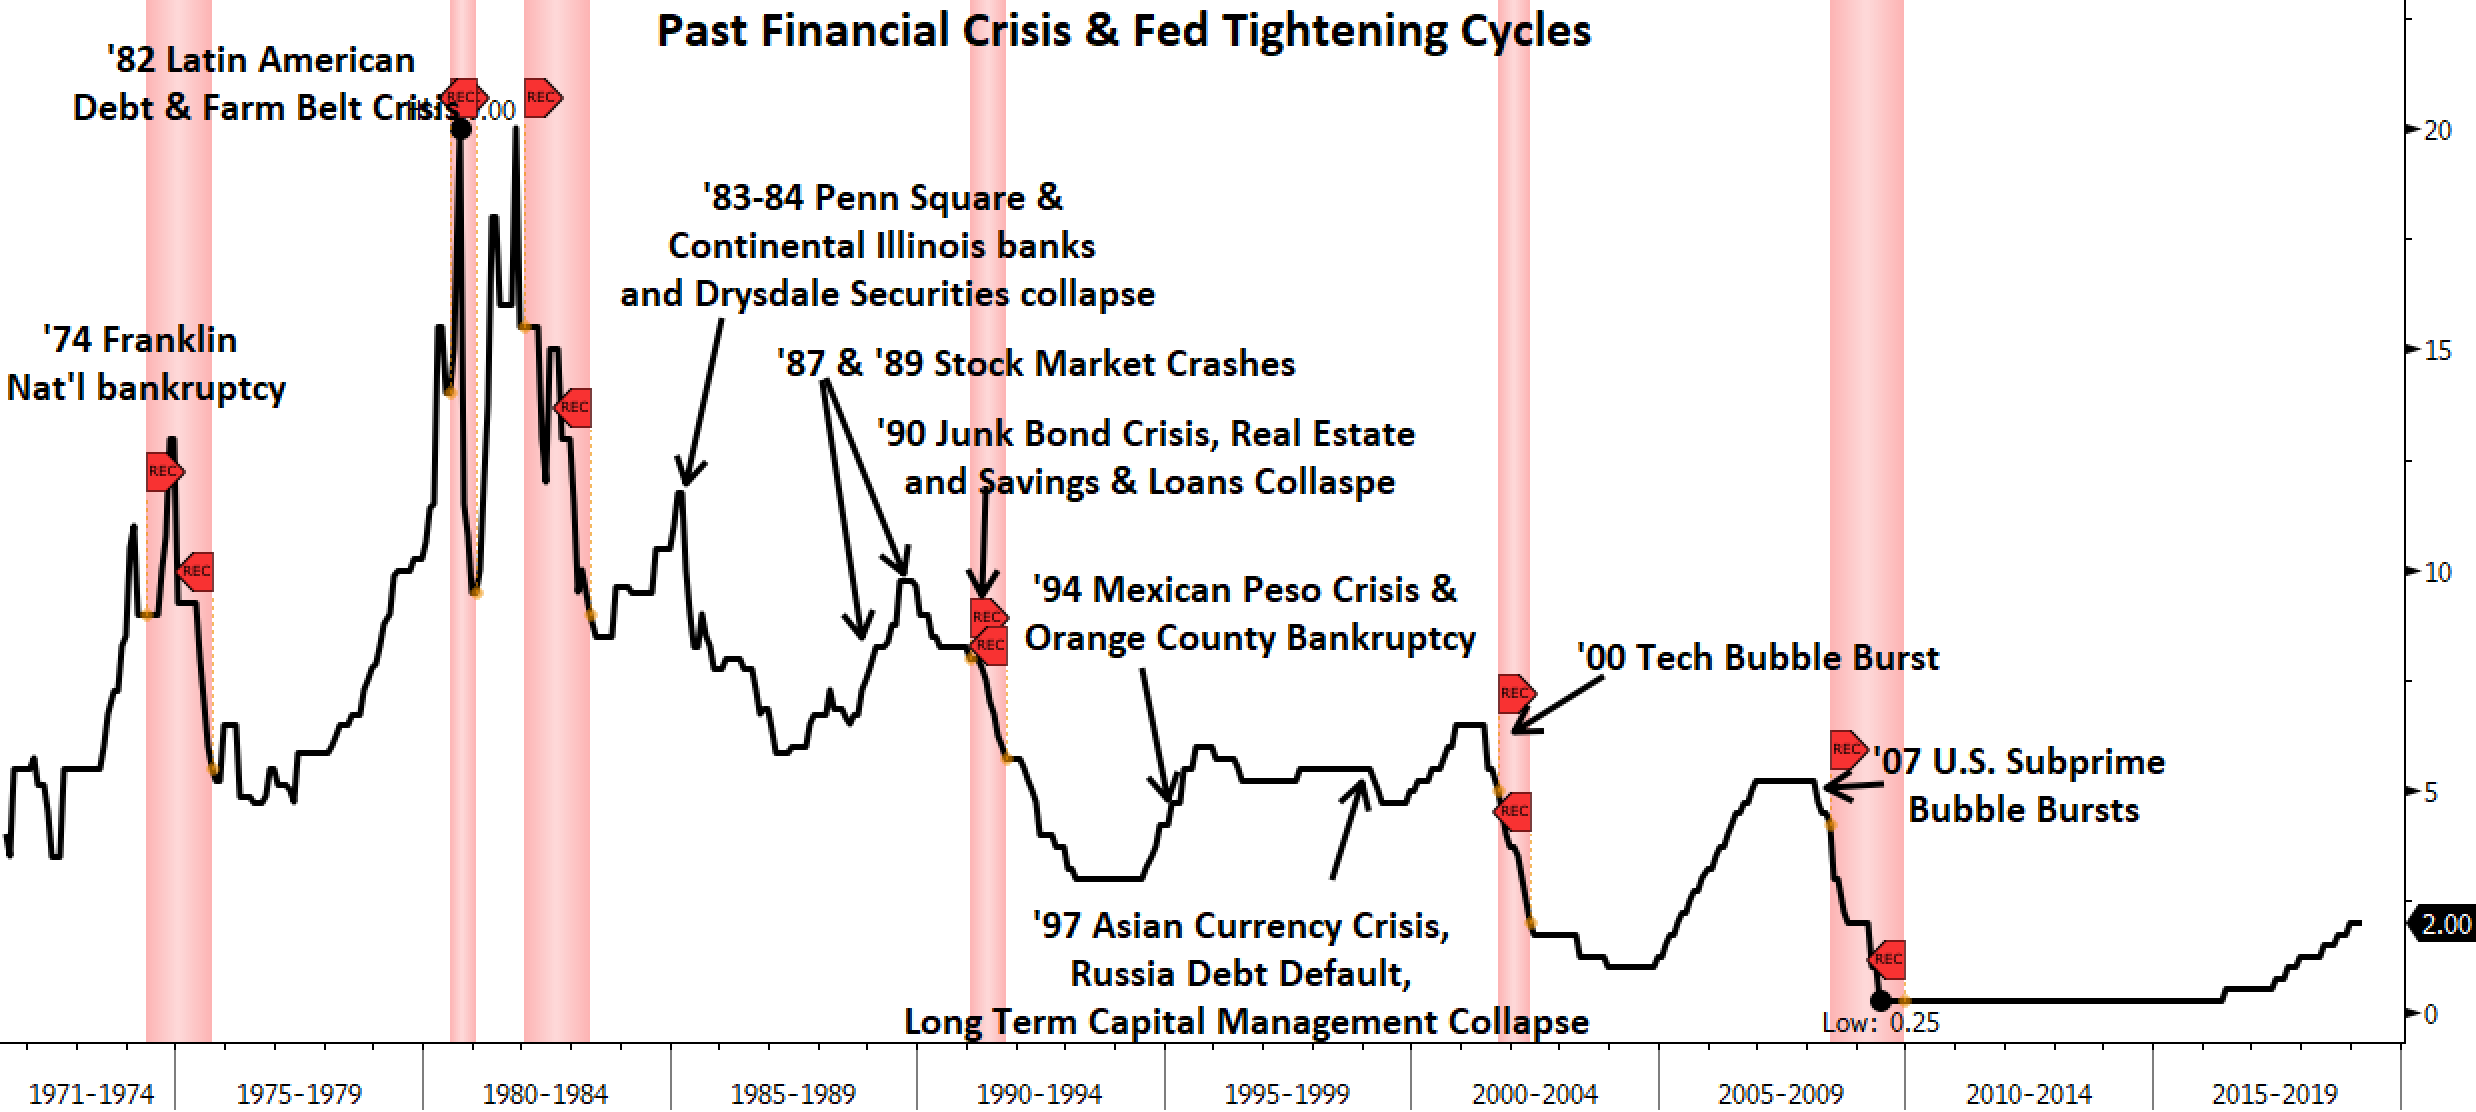
The question of whether or not the Fed is close to breaking something in the markets or economy should be weighing on the Fed and investor’s minds. To get a sense of how close we may be to the terminal Fed Funds Rate and the end of this rate hiking cycle we can look at how much tightening occurred in past cycles compared to the present. When we look at the last six cycles, three of them occurred during a secular rise in interest rates in the 1970s and we saw three cycles occur during a secular decline in interest rates around 1980-2000. The average increase in the Fed Funds Rate during the 1970s cycles was 9.58 percent, significantly above the average in the last three cycles which was around 3.88 percent increase in the Federal Funds Rate.
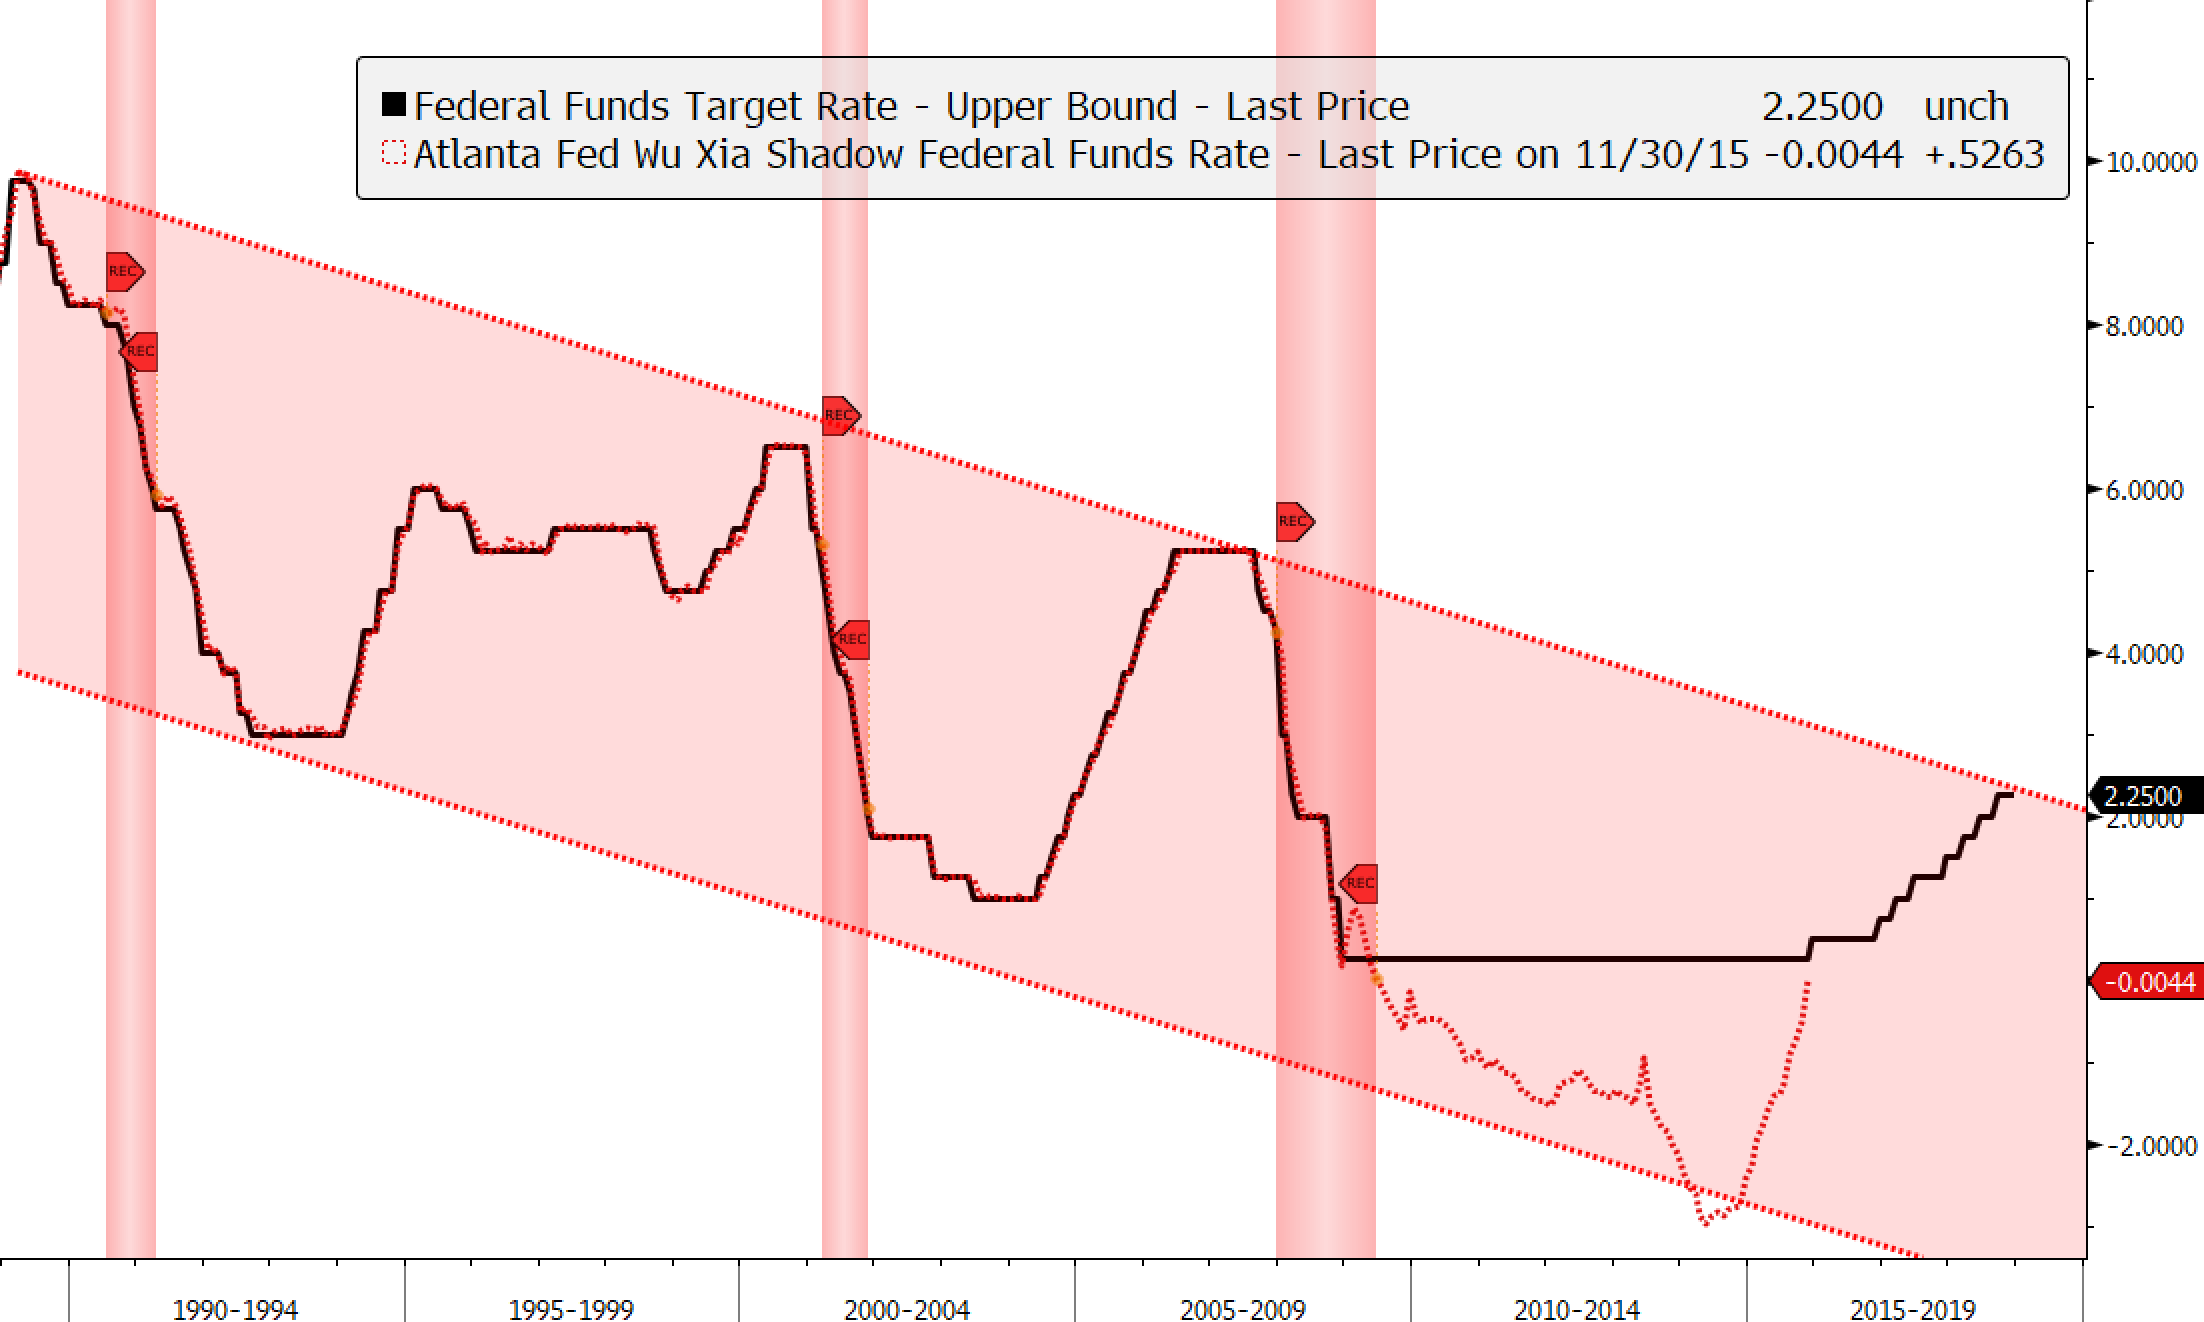
This cycle was different as the Bernanke-led Fed took interest rates down to zero and went one step further with its quantitative easing (QE) program by expanding its balance sheet to buy financial assets. The Atlanta Fed estimated the impact of the Fed’s QE program when expressed as an interest rate cut and came up with the Atlanta Fed Shadow Federal Funds Rate. They estimate that all of the Fed’s QE programs pushed rates down to negative three percent by 2014 and when we use that as a bottom and assume the Fed will raise a quarter point at next week’s meeting we find that the Fed has tightened by 5.50 percent, greater than any of the cycles in the last quarter century!

Currently, not only is the Fed raising interest rates but it has begun to shrink its balance sheet, what investors are calling “Quantitative Tightening” (QT). We can do some back of the envelope calculations to estimate what the impact of QT expressed as an interest rate hike by measuring the impact of QE. From the middle of 2009 to the middle of 2014 the Atlanta Fed Shadow Federal Funds Rate fell from 0.00 percent to -3.00 percent while the Fed’s balance sheet grew from $2T to $4.4T. If we take the difference of $2.4T and divide that by 3.0 percent – the amount of interest rate reduction seen by the Shadow Fed Funds Rate – we get a ratio of roughly 0.80, which means for every trillion expansion in the Fed’s balance sheet under its QE program, we saw roughly an interest rate cut of 0.80 percent in the Shadow Fed Funds Rate.
Using that back of the envelope calculation, a rough approximation for the impact of the Fed’s QT program shrinking its balance sheet from $4.5T to $4.1T this year equates to a 0.32 percent increase in tightening ([4.5-4.1]*0.80). Considering the Fed has hiked rates already from 1.25 percent in December 2017 to 2.50 percent and assuming the market is correct that the Fed hikes next week, we are looking at 1.25 percent in actual rate hikes and 0.32 percent in implied rate hikes from QT, which equals over 1.57 percent in total tightening this year. Take the estimated 0.32 percent hiking from QT added to the 5.5 percent estimate of total tightening in the table above, we are looking at 5.82 percent of total tightening. Is it enough to cause something to break economically or financially?
The Fed May Have Raised One-Too Many Times Already
If we look at the Federal Funds rate over the last three rate cycles we see peaks occur at progressively lower levels before they cause a recession (red vertical bars). This makes sense as the total debt in our economy continues to grow relative to the size of our economy, thereby increasing our economy’s financial leverage. With greater amounts of leverage it takes less of a decline before one begins to feel the pain of rising interest rates. If we draw a simple trend line, we see that when the Fed Funds Target Rate reaches the upper trend line we have been close to a peak in the past. Given that we are virtually at the upper trend line of the past few decades, we should be getting progressively worried that the Fed may have hiked too much already.
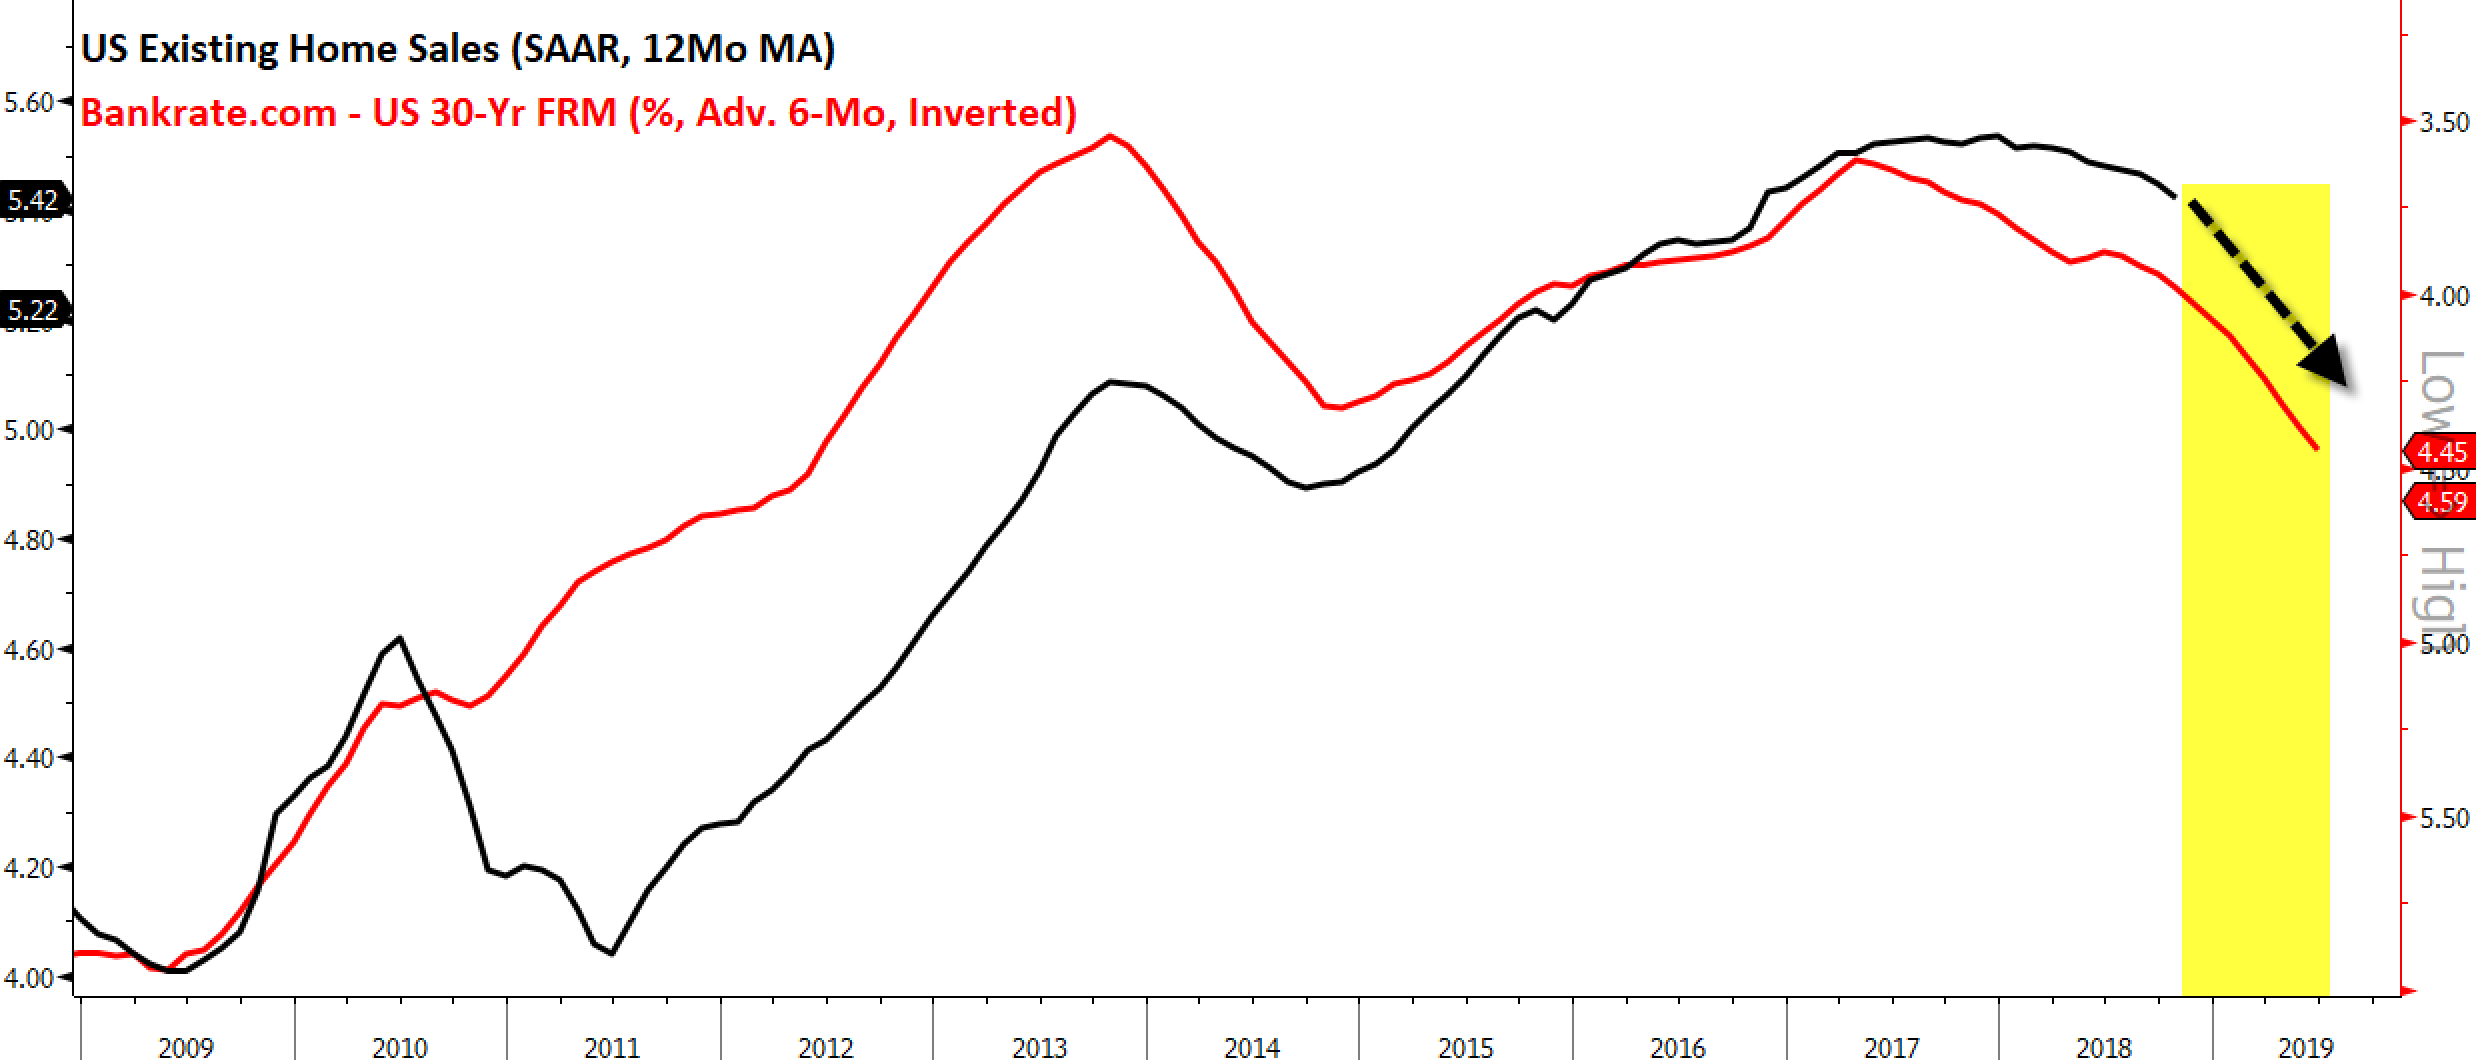
For signs that Fed rate hikes might be starting to bite, one simply has to look at the most cyclical and interest rate-sensitive areas of the economy: housing and autos. When we consider these areas there are reasons to be concerned the Fed may already have raised one rates too far. Consumer attitudes toward home buying are quickly deteriorating down to levels not seen since 2009 after the housing bubble burst. The University of Michigan Consumer Survey asks about consumer attitudes toward buying a home, and their levels tend to lead home price appreciation over one year. It argues that we should see continued slowing in home price appreciation throughout 2019 and the rate of slowing could be substantial.
In addition to inflated prices weighing on consumer attitudes toward purchasing a home, the cost of financing that purchase has increased dramatically over the last two years. The 30-year fixed-rate-mortgage (FRM) tends to lead existing home sales by six months and says that home sales should continue to cool heading into 2019. For the first time in years, housing is likely to be a drag on economic growth.
Looking at autos shows this cyclical area of the economy may also have a rough 2019. Like housing, consumer attitudes toward new car purchases is deteriorating and tends to lead auto production by nine months. It predicts a sharp slowdown in auto production and sales heading into 2019.
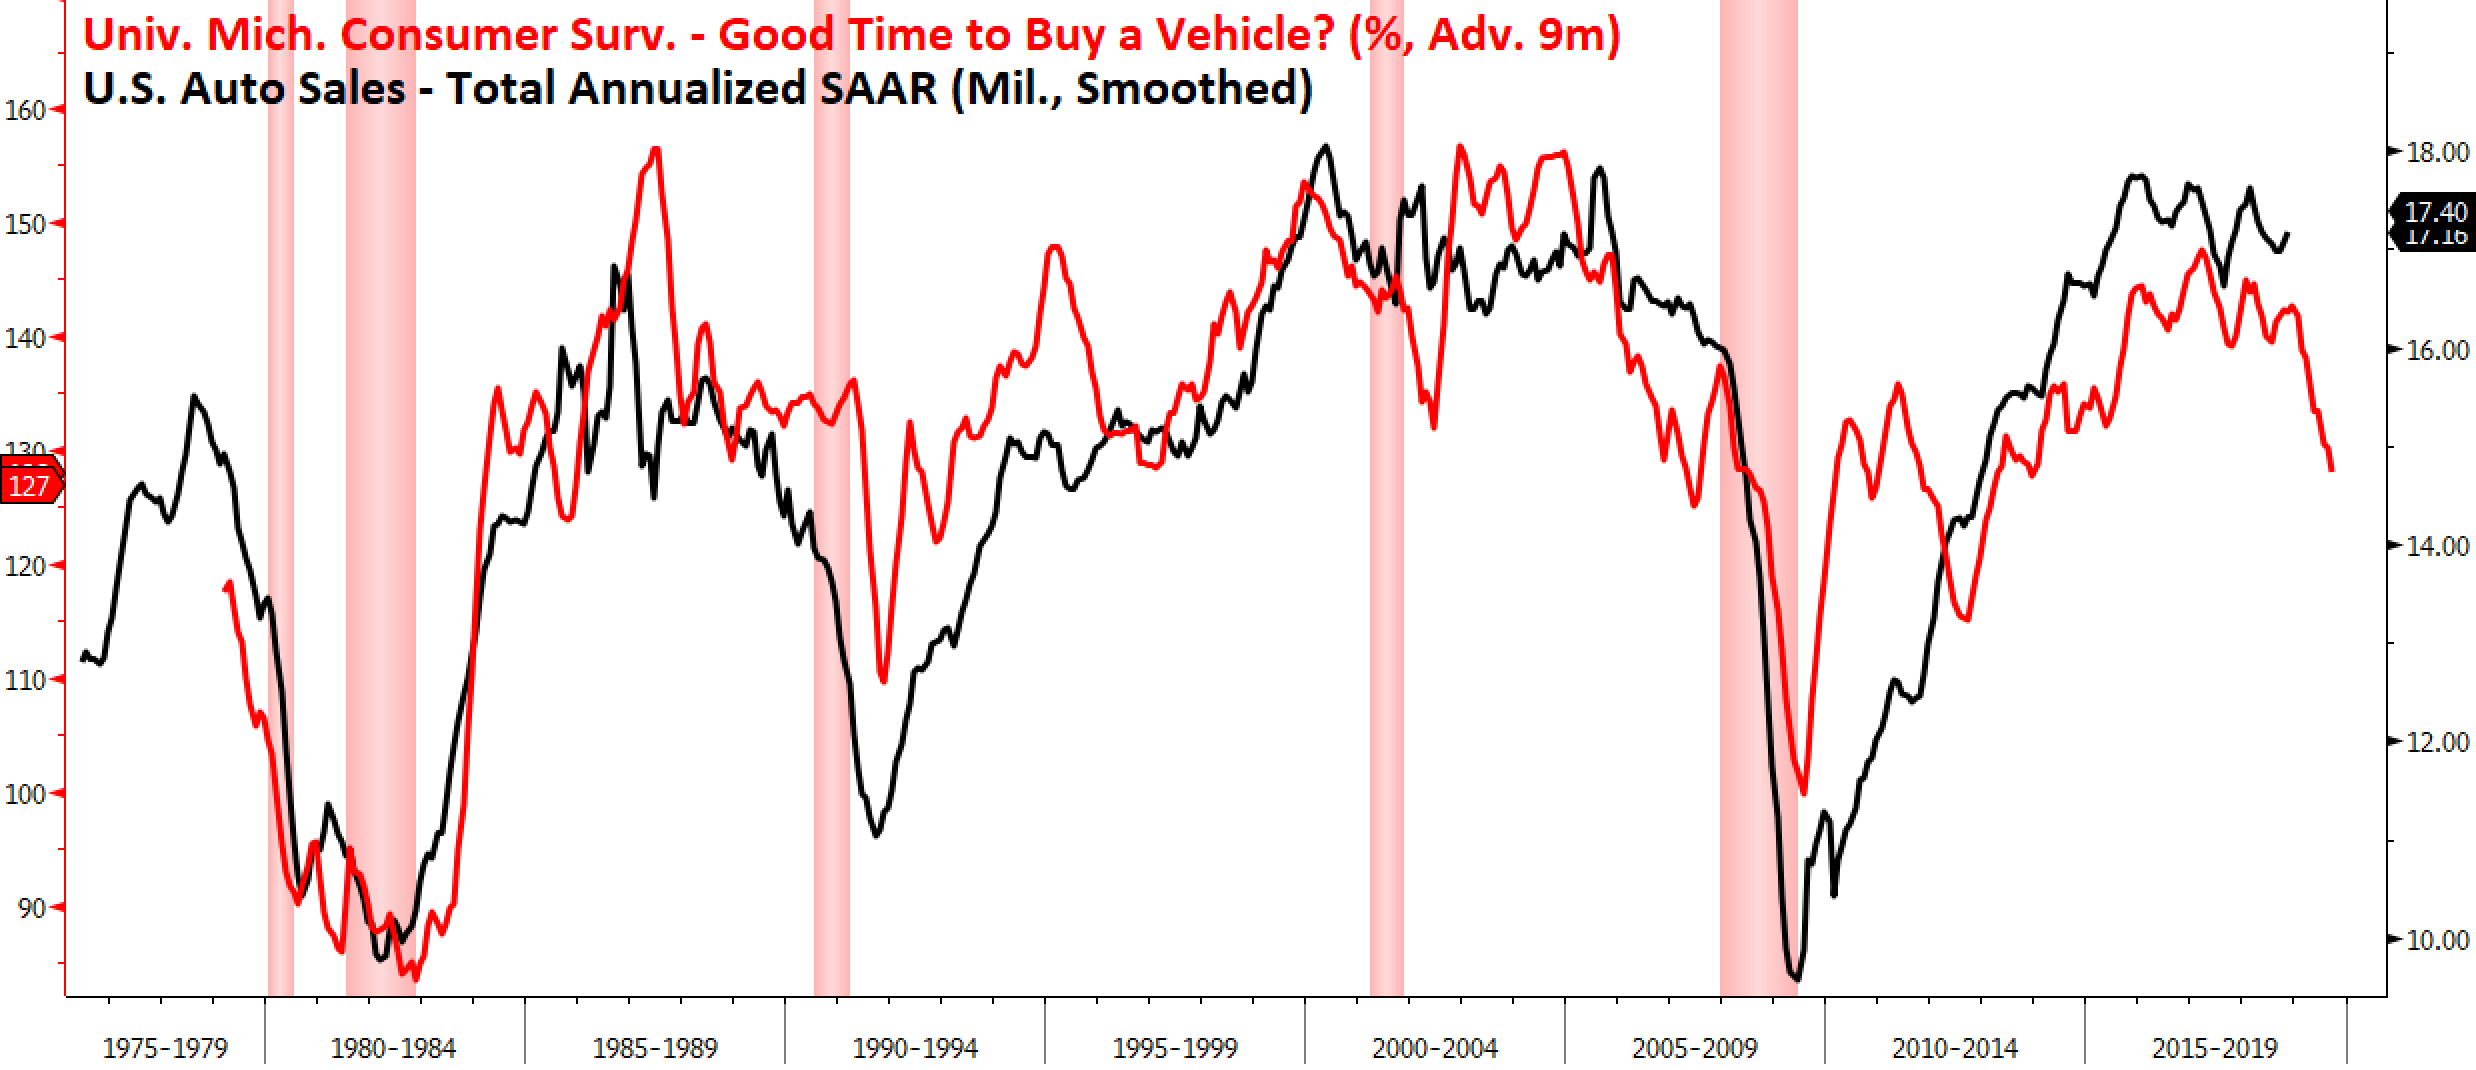
The labor market would not be fond of this news as peaks and troughs in auto production tend to lead the unemployment rate (as measured by the U3 rate) by nine months. The data tells us we may have seen or will see shortly the low for the unemployment rate for this economic cycle.

The stock market is a leading economic indicator in which it tends to predict turns in the economy months in advance. The S&P 500 is one of the 10 leading indicators in the Conference Board’s Leading Economic Index and it often peaks ahead of recessions by an average of six to nine months. Watching various segments of the stock market can give clues on what future economic data may bring. When we look at interest rate-sensitive sectors of the market such as housing, automobiles and finance, the current price declines argue for further economic weakness heading into next year. Looking at industries in the S&P 1500 supercomposite – which includes the S&P 600, 400, 500 small, mid, and large-cap indices – there has been considerable damage in these areas this year. The home furnishings industry is down 43.6 percent, the home building industry is posting a loss of 31.62 percent, and as the chart below illustrates the pain isn’t only felt in those industries alone.

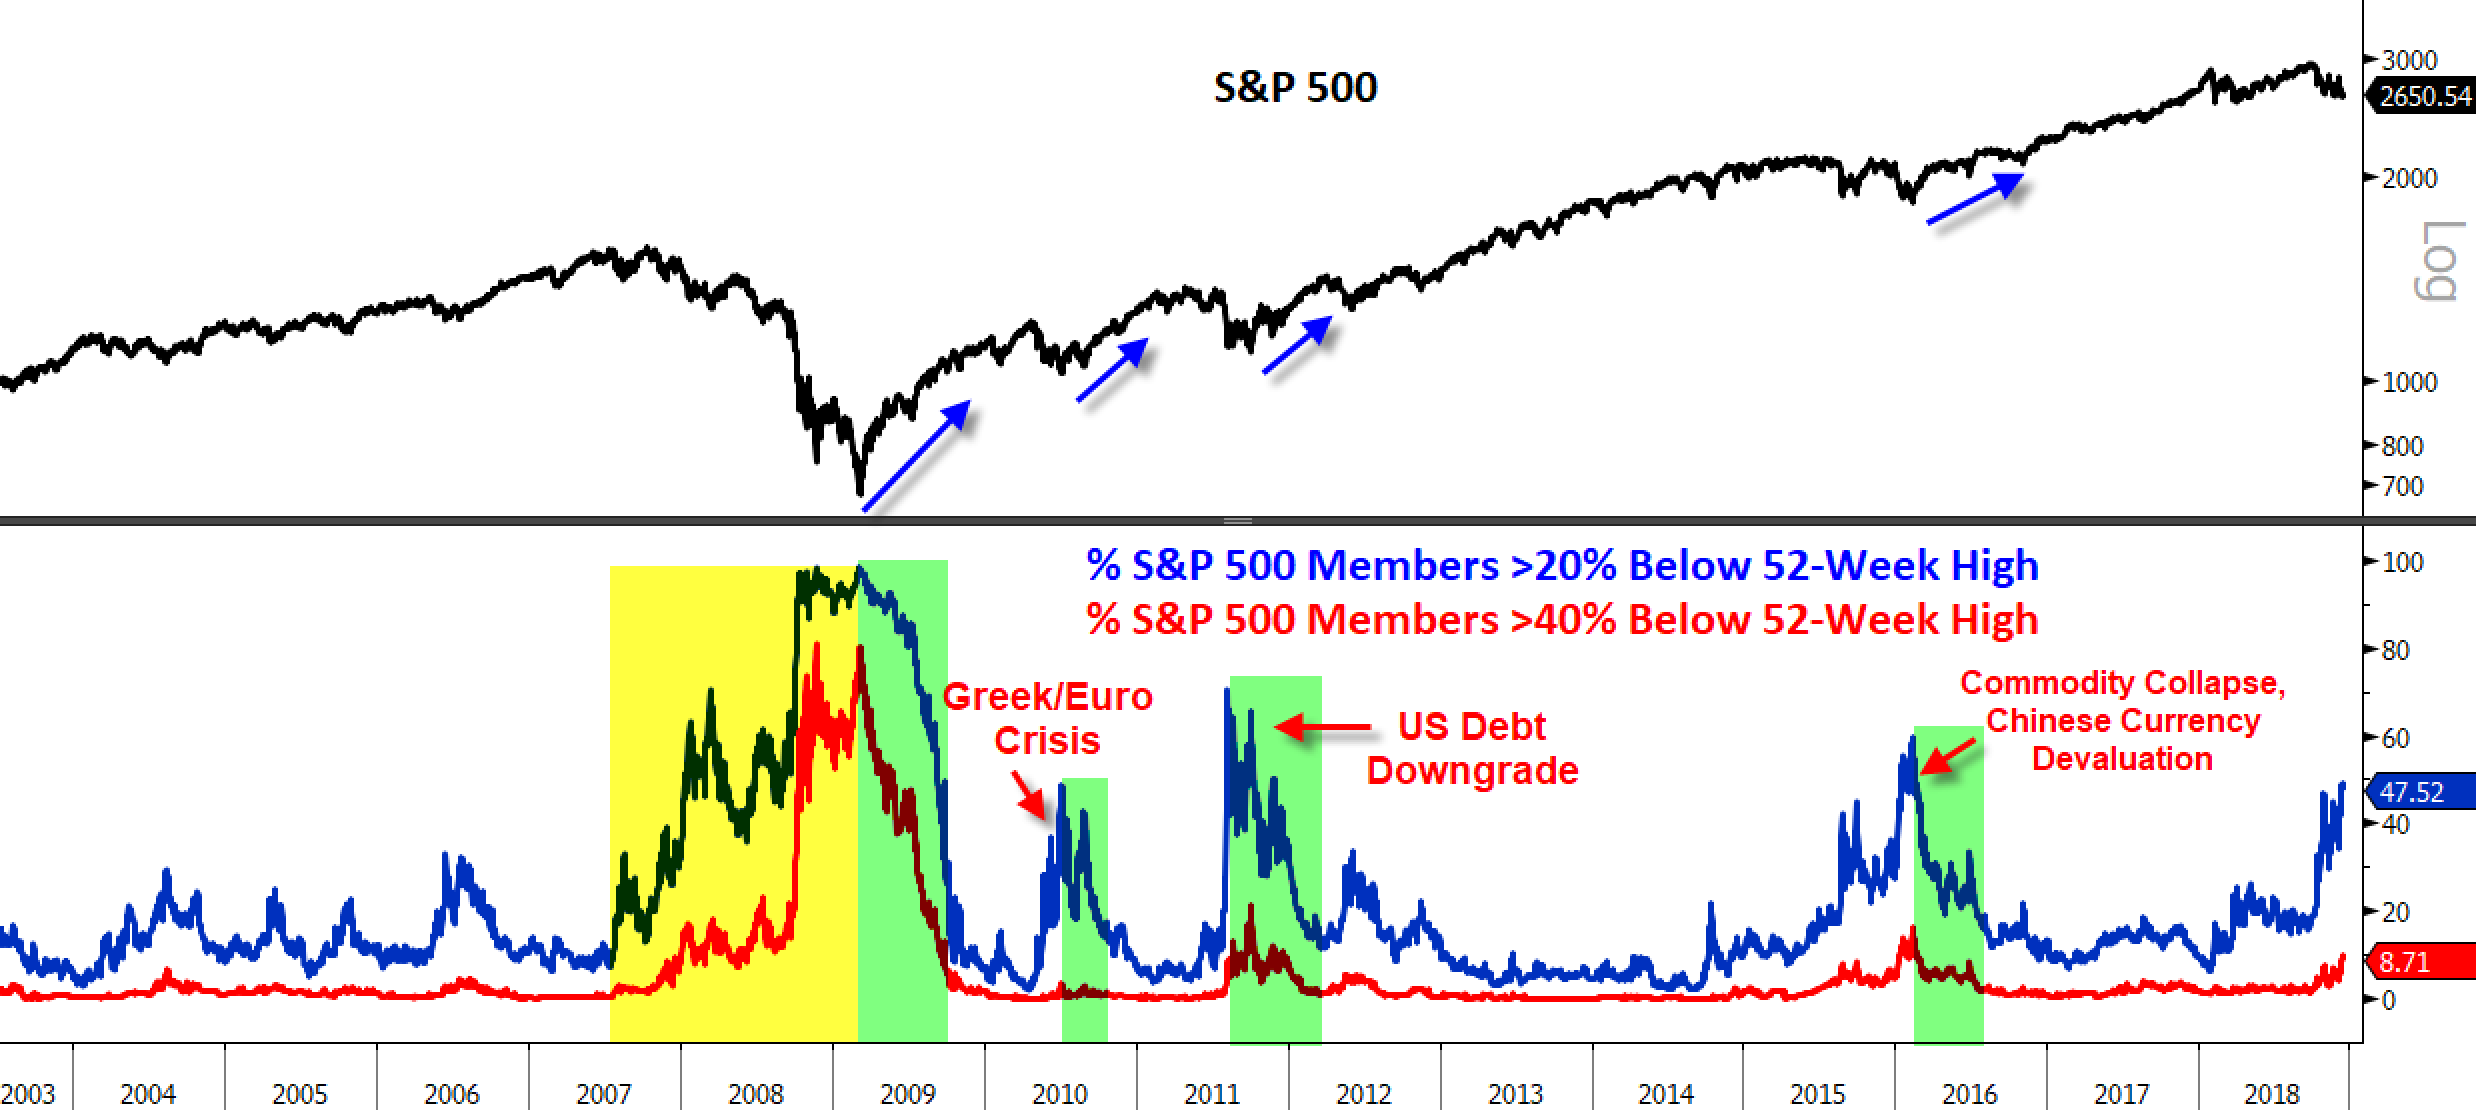
Weakness in the stock market is not isolated to interest-rate sensitive sectors alone as more than 47 percent of the S&P 500 members are currently in bear markets (down more than 20 percent from their highs) and nearly nine percent of the 500 members are more than 40 percent off their highs!
We didn’t see readings like these in the last bull market until the market peak in late 2007 but this cycle has been anything but normal. As shown below, there have been several times where more than 40 percent of the S&P 500 members entered a bear market. In the past, you got an all-clear signal when the percent of members in bear markets fell dramatically (green shaded regions) which is why going forward, it's going to be critical to see the number of stocks in bear markets contract. When we did see a contraction in the number of stocks in bear markets, the S&P 500 regained its footing and advance (blue arrows below). If they continue to expand as they did throughout 2007-2008 it would be a major warning signal (yellow shaded region below).
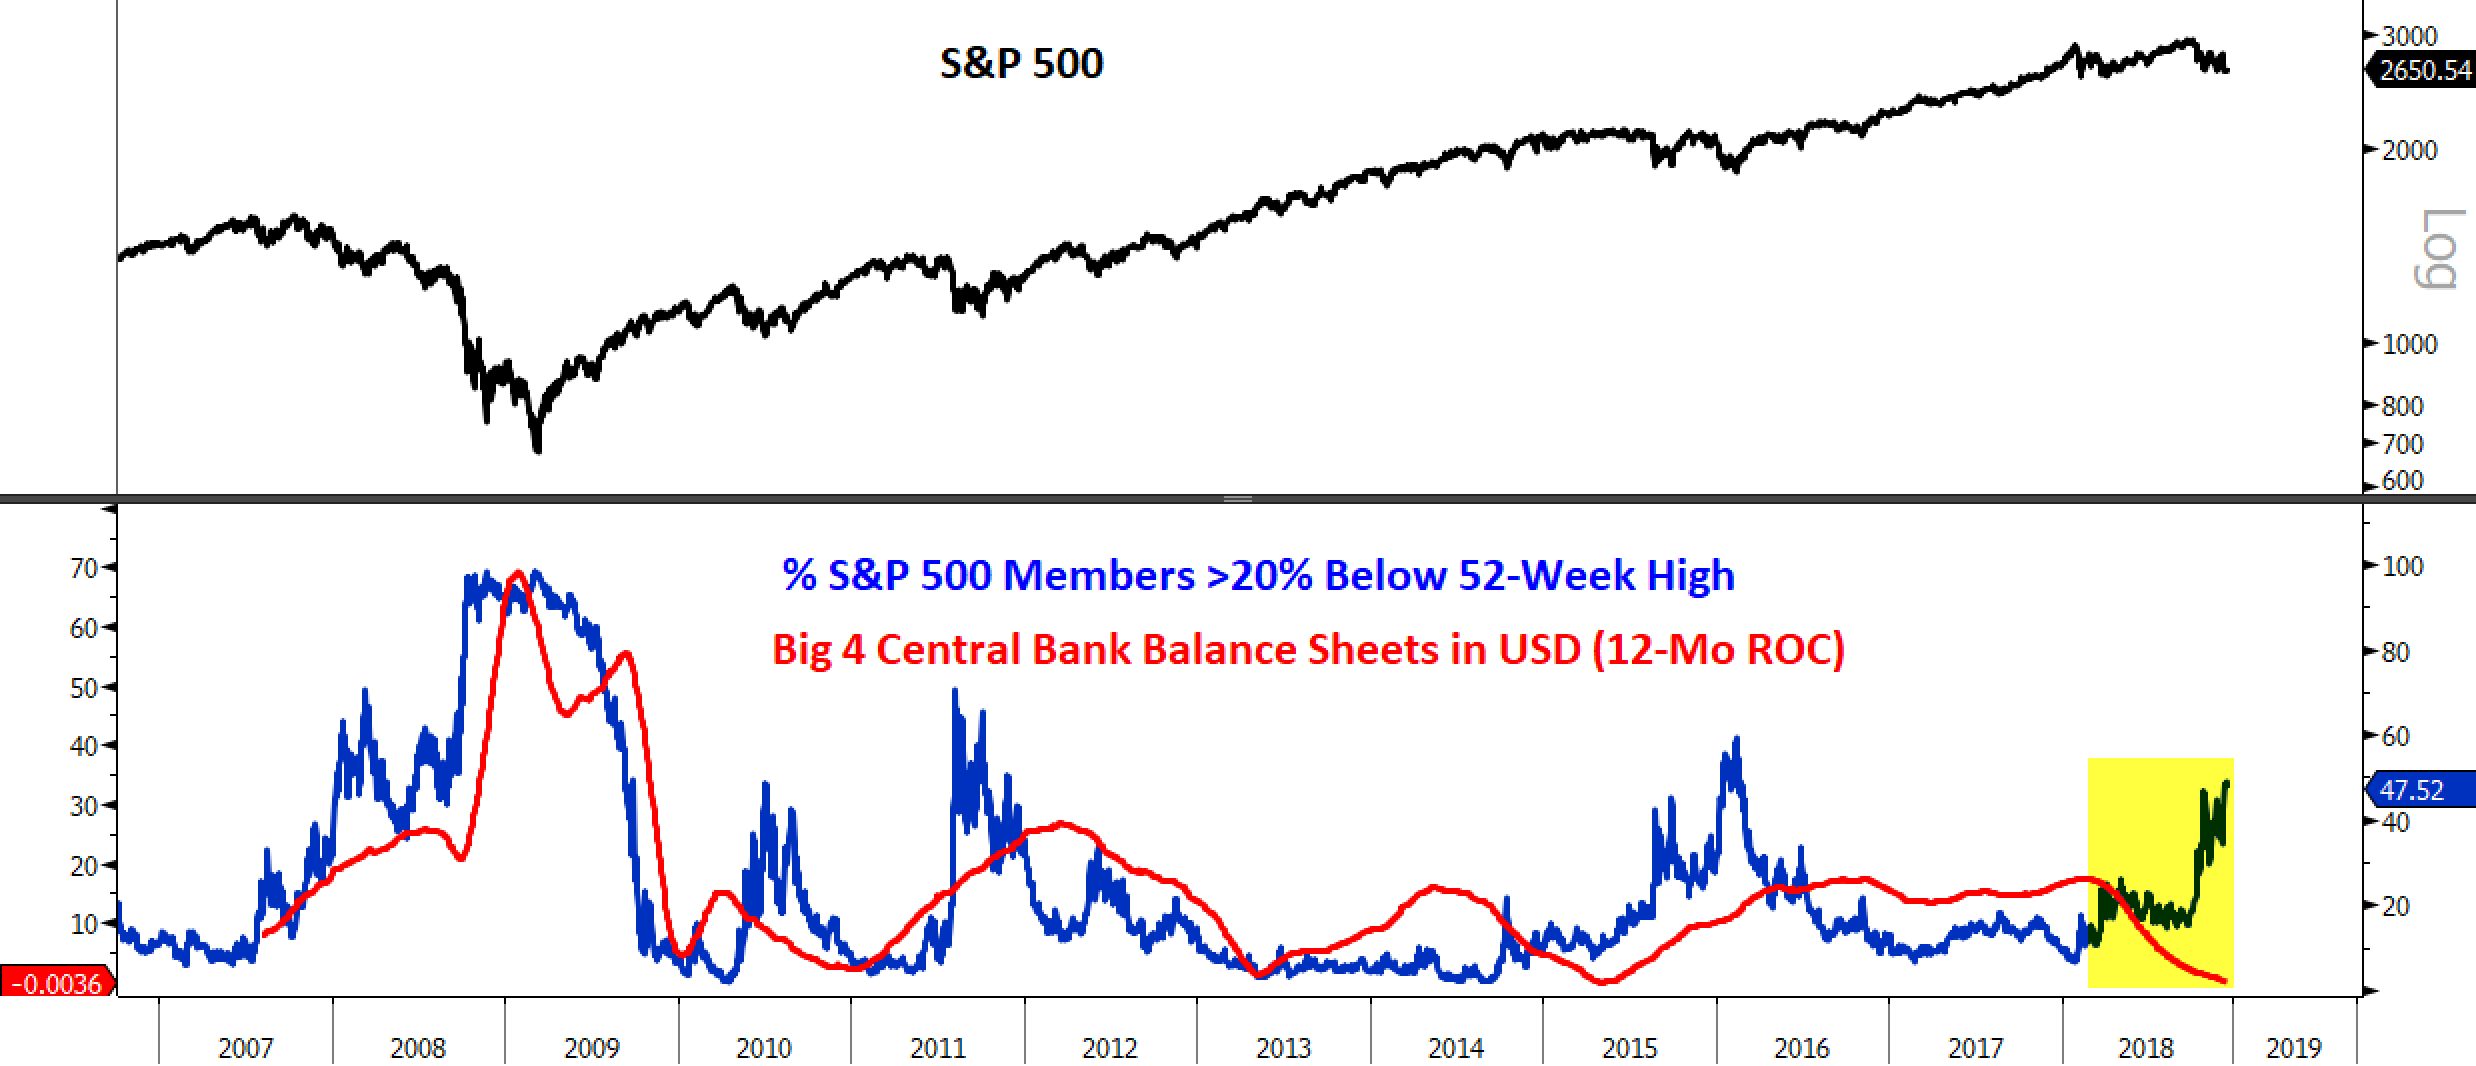
Aggressive central bank easing helped pull the stock market out of the ashes from the 2010, 2011 and 2016 corrective episodes. This time around not only is the Fed tightening by raising interest rates and shrinking its balance sheet, but the European Central Bank is also ending its QE program.
ECB ends €2.5tn eurozone QE stimulus programme
The European Central Bank has confirmed it is ending its huge net asset purchase program to stimulate the eurozone economy this month.
The ECB stopped its bond-buying scheme, worth € 30bn a month, despite a recent slowdown in the bloc's recovery.
The move, first announced in June, is a big step toward unwinding the policies brought in to stabilize the eurozone in the wake of the financial crisis.
The ECB said it was keeping its main interest rate on hold at zero percent.
The ECB began its asset purchase program in 2015, years after the U.K. and U.S. took similar action to shore up their economies.
It has so far pumped more than two trillion euros into the bloc's economy, while maintaining ultra-low interest rates
In response to the Great Financial Crisis of 2007-2009 as well as the Greek debt saga of 2010, the U.S. debt downgrade of 2011, and the Chinese currency devaluation of 2015, collectively the Fed, Bank of Japan (BOJ), Bank of England (BOE), and the European Central Bank (ECB) expanded their balance sheets with QE programs which would flood the global financial markets with liquidity and risk assets like stocks responded by heading higher. You can see this below by looking at the percentage of member sin the S&P 500 in bear markets in the bottom panel along with the annual change in the big four central bank balance sheet assets. In stark contrast to prior episodes of widespread pain in the stock market, global central bankers continue to pull back on the reigns of the QE wagon (yellow shaded region below) which could mean equity markets will have to fend for themselves as the global central bank put has expired.
Looking beyond central bank balance sheets to larger monetary aggregates only adds to the concern that stocks may not recover as quickly as they have in prior episodes. Global M2 money supply has been declining all year and its peak was in sync with the peak in global equities and both have trended lower all year.

In addition to impacting global equities the trends in global M2 also impact the credit markets where credit spreads tend to widen when monetary liquidity begins to shrink and until we see global M2 increase gain U.S. credit markets are likely to remain under stress.

It is unclear what it will take to get the attention of the world’s central bankers. We have scores of U.S. and foreign equities in bear markets and yet central bankers continue on their tightening paths. In addition to weakening global equity prices we are also undergoing a global slowdown in which 97 percent of the OECD countries are displaying positive growth (black line below), only five percent of the OECD countries are displaying accelerated growth from the previous year. Global economic growth momentum hasn’t been this week since the 2010-2011 period, back when the Fed was doing QE 2 in which the Fed bought $600B worth of U.S. Treasuries.

Summary:
Next week’s FOMC meeting outcome will likely end the market’s consolidation over the last two months. If the Fed turns a deaf ear to the market and does not signal a pause in rate hikes we will likely see markets in the U.S. and globally continue to sell off and break down to new lows. However, if the Fed finally acknowledges the material slowdown underway in interest-rate sensitive sectors like housing and autos and signals a pause we will likely be treated to a sell off in the USD and a rally in risk assets over the coming weeks. Even if the Fed does halt its rate hiking campaign it may have already raised rates too high considering how much tightening has already taken place compared to prior cycles.
The trend in tighter monetary policy is not solely a U.S. phenomenon as global M2 money supply also contracts, weighing on risk assets across the globe. We've also seen an erosion in global economic growth momentum and taken in conjunction with slowing global liquidity it's not a recipe for strong risk asset performance. Consequently, investors may want to position themselves defensively heading into what is likely to be a very volatile 2019.


