


Summary:
COVID-19 infections are not declining as was widely hoped entering the summer months
Exponentially rising cases in some states are pushing hospital capacity to the brink
The resurgence in infections is shifting mobility and business trends in the wrong direction
The disconnect between the market’s V-shaped recovery and the economy is partially explained by the stock market’s sector composition
In light of these changes, we are reducing our allocation to the stocks
Over the last few months, we have voiced our optimistic outlook that the economy would recover like the stock market has, albeit at a milder pace, with a U-shaped versus a V- shaped recovery (see Alphabet Soup). We were optimistic regarding the outlook due to the record-breaking monetary and fiscal stimulus thrown at the markets and economy. These efforts have clearly had an impact on the stock market and have arrested the economy’s plunge that took place over the spring.
We are also cognizant of the fact we are dealing with major unknowns regarding the outlook for the COVID-19 pandemic and how consumers and fiscal and monetary authorities will react. Therefore, we feel the primary theme over the next year will clearly be elevated volatility, and in both directions. Our job as portfolio managers is to understand where the consensus is regarding the economy, markets, the COVID-19 pandemic, to determine where the consensus is wrong and then manage risk around turning points in consensus beliefs. We cannot afford to be political but instead let the data guide our decisions and determine where the dislocations are in the market and act appropriately.
That is why this article is full of charts and graphs and less on pontificating. The title of this article is a quote thought to have been said by the famous economist John Maynard Keynes in response to critics who said he changed his opinions too frequently. Outlined below is our rationale for why we have changed from a neutral position in stocks to a near minimum risk position.
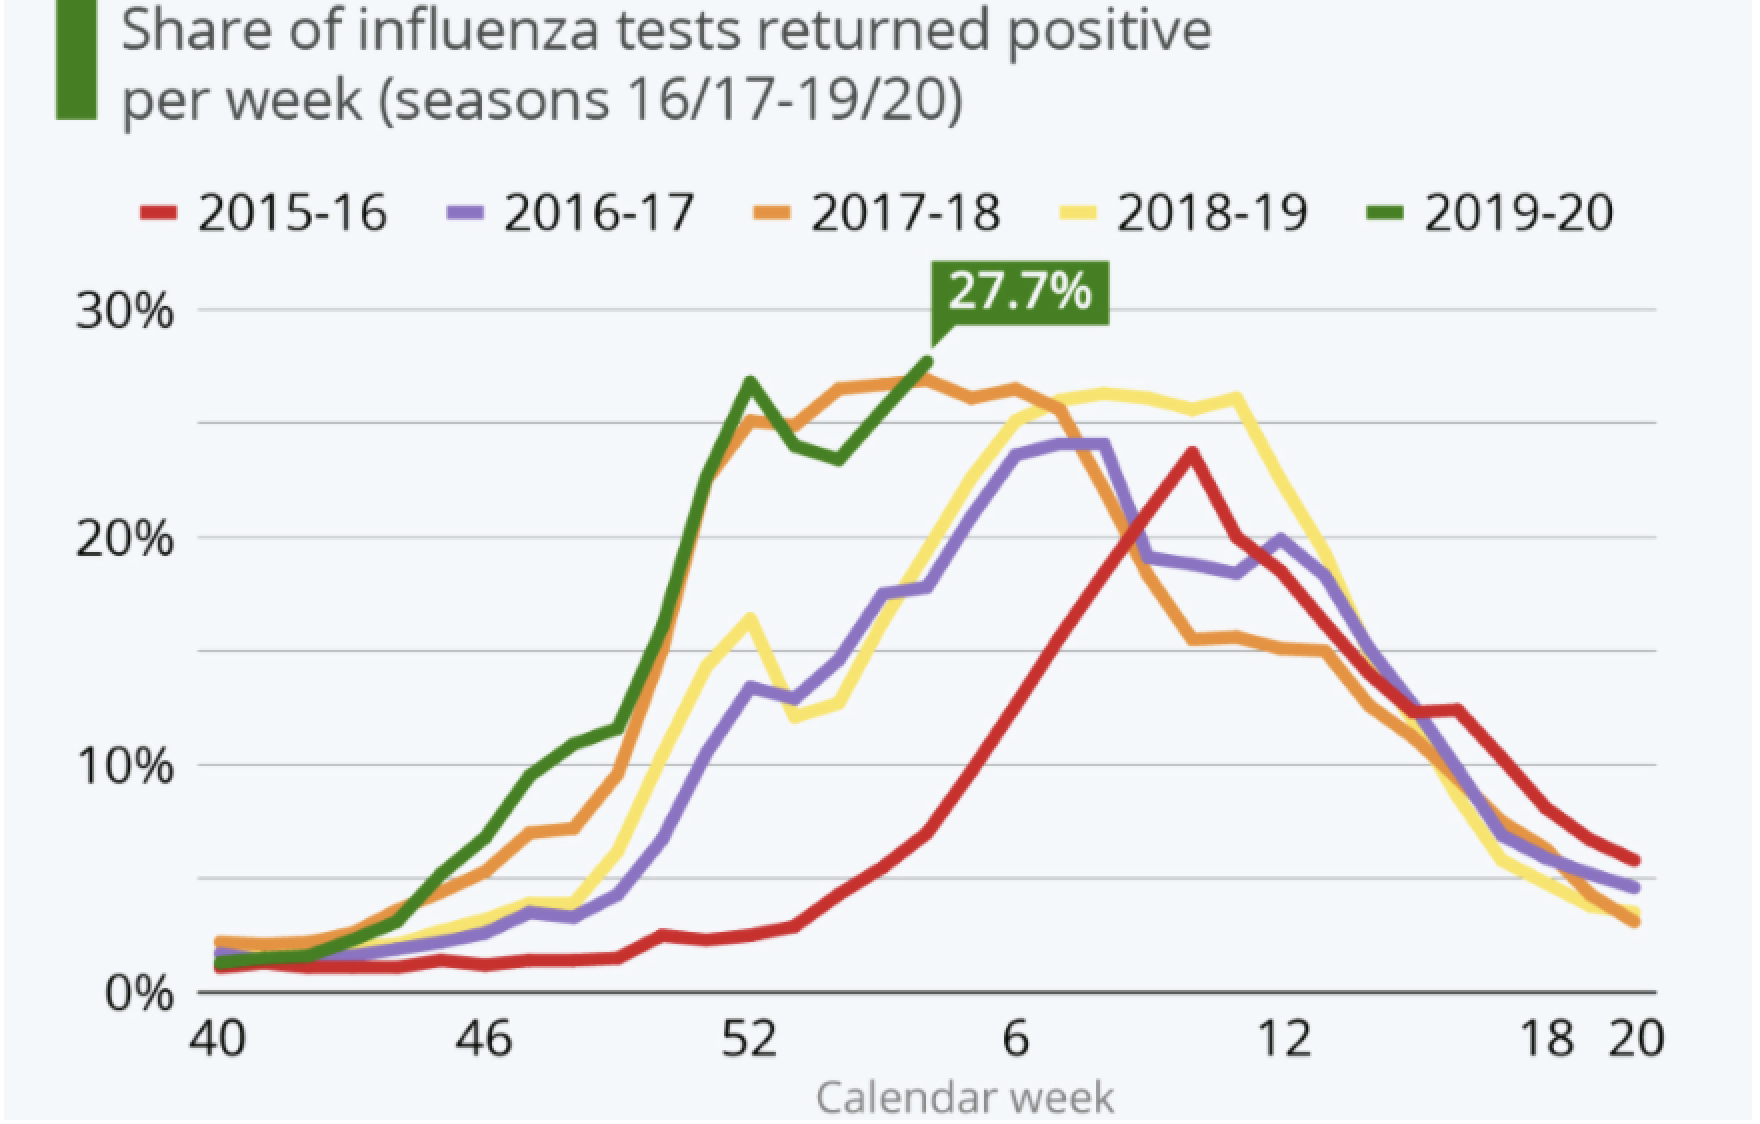
As we were approaching the summer months it was believed, if not hoped, that COVID-19 cases would dramatically fall as is typical of most influenza viruses. Many thought as we entered the fall, we would have a vaccine or would be close to having one, and we would have medical treatments to reduce the severity of the infection. This pattern of reduced influenza cases over the summer is shown below for the past five flu seasons in the United States.
However, since reopening up our economy, we have seen a surge in cases over the last few weeks. Shown below is the five-day average daily change in confirmed cases for all 50 states. New York was the hotspot of the outbreak in the U.S. and dominated all other states followed by New Jersey. With New York’s strong lockdown, they began to flatten their curve dramatically and other states flattened their curve over April and May. In California, there has been a consistent increase in the daily growth of cases, and it continues to build. Recently, states like Florida, Texas and Arizona have begun to show an exponential rise in new cases. Click here for an animated version of the chart below.

Shown below are current active cases globally (black line, left scale) and in the U.S. (blue line, right scale). You can clearly see there isn’t a peak in the number of active cases as was widely hoped. What makes this concerning is that we started with 36K active cases globally and eight active cases in the U.S. in early February. Look at how those case numbers ballooned to where we are today with 4.3M active cases globally and over 1.6M active cases in the U.S. The concern is that if we continue to build the number of active cases over the summer that by the time we enter the 2020-2021 flu season we won’t have a few thousand cases of COVID-19, we will have millions.

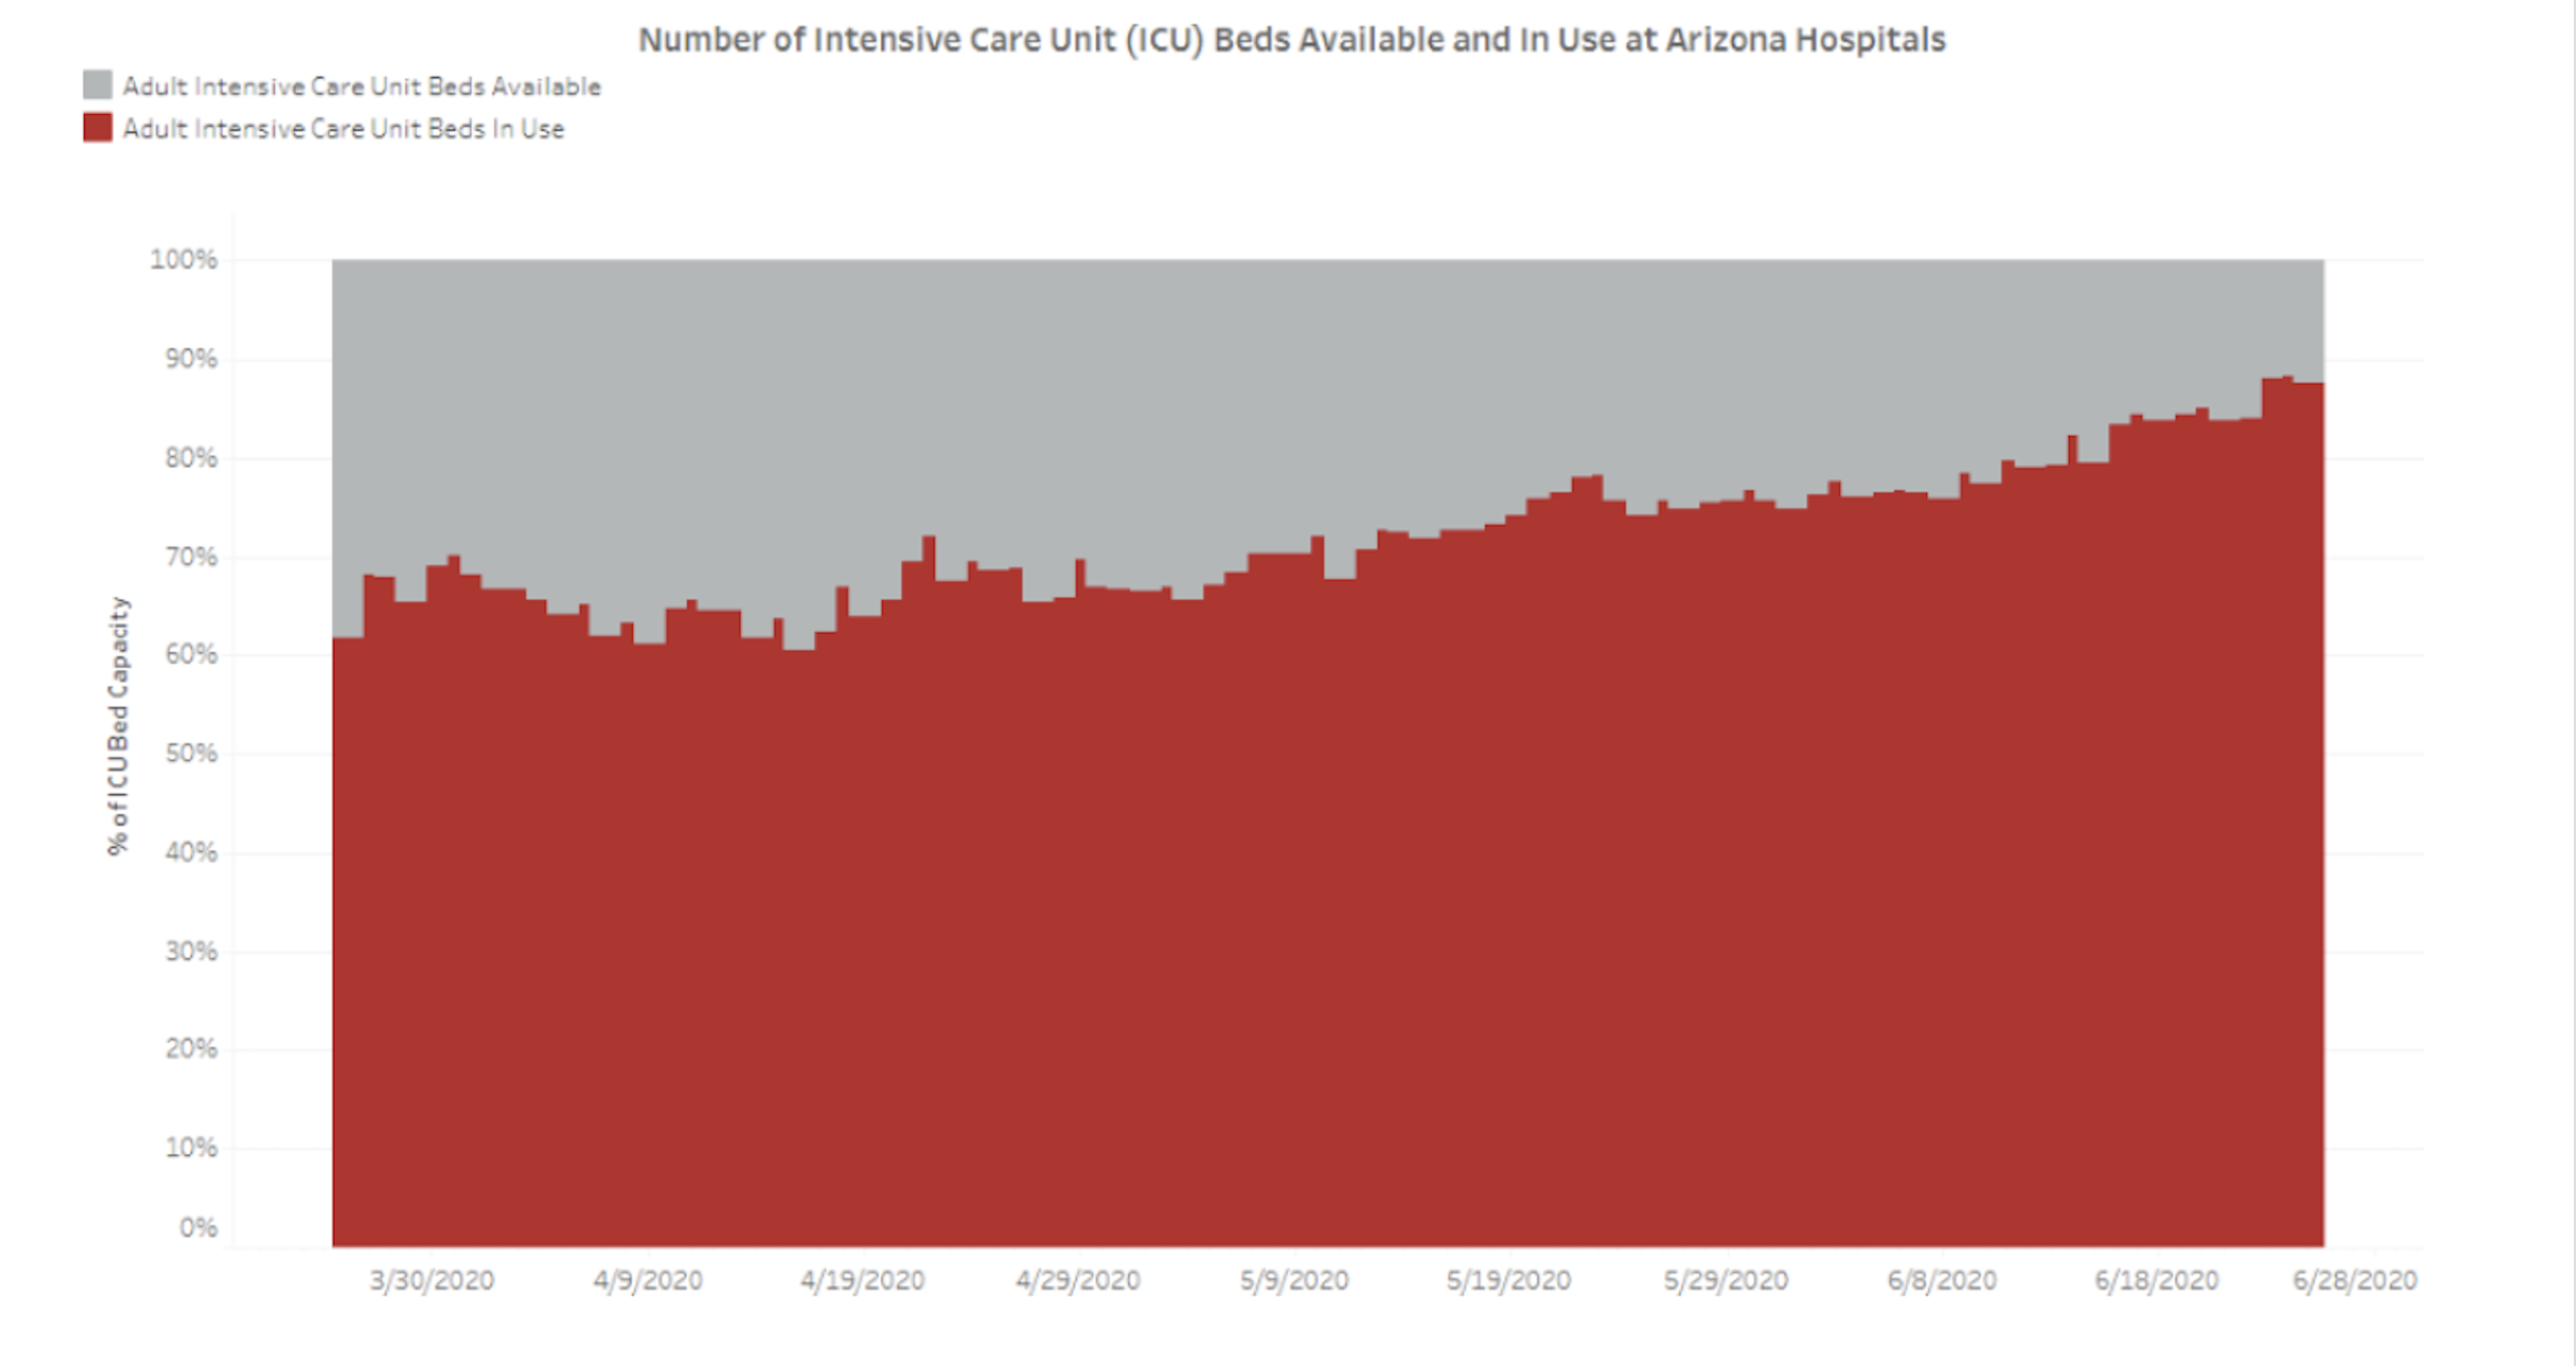
In the states that are currently seeing an exponential rise in cases, their hospitals are nearing full capacity in terms of beds and ICU beds. Back in March, Arizona had over 60% of its ICU beds in use which has steadily risen to nearly 90% utilization. At this pace, Arizona will be at 100% utilization of ICU beds in a month.
Arizona is not alone. Texas is in even worse shape as they reached full capacity on June 25 and will exceed sustainable surge capacity just after July 4.

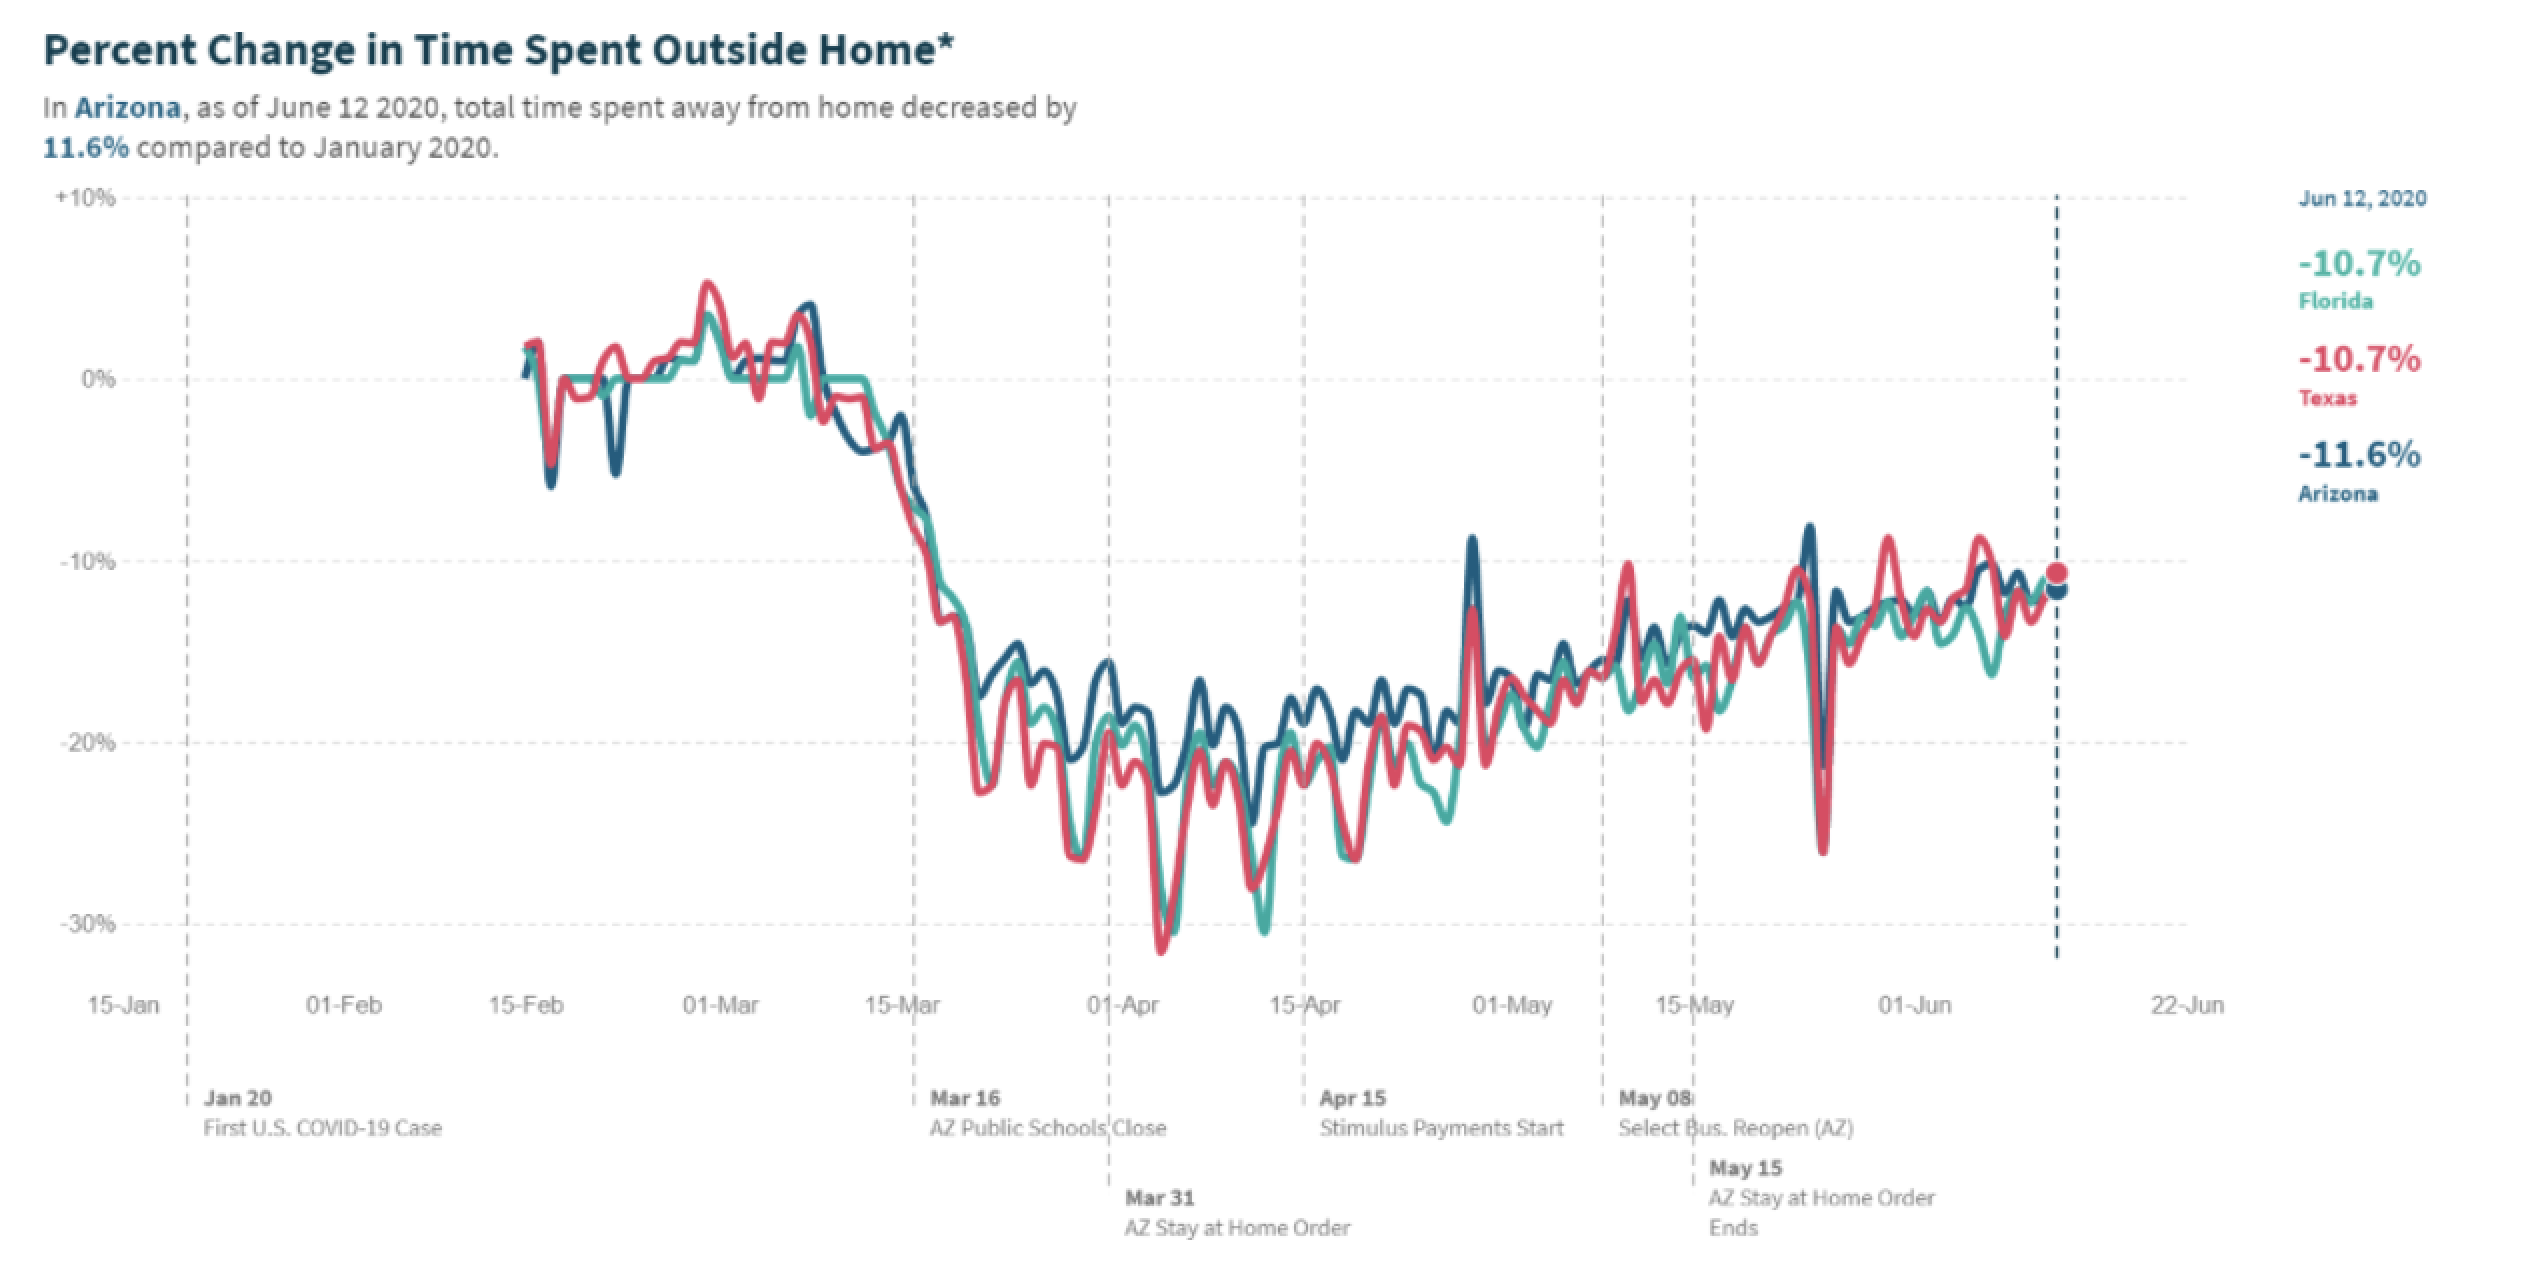
The outbreak of COVID-19 infections in Arizona, Florida and Texas is starting to impact consumer and business behavior. The percent of time spent outside of the home began to recover in May but has flattened over the last few weeks.
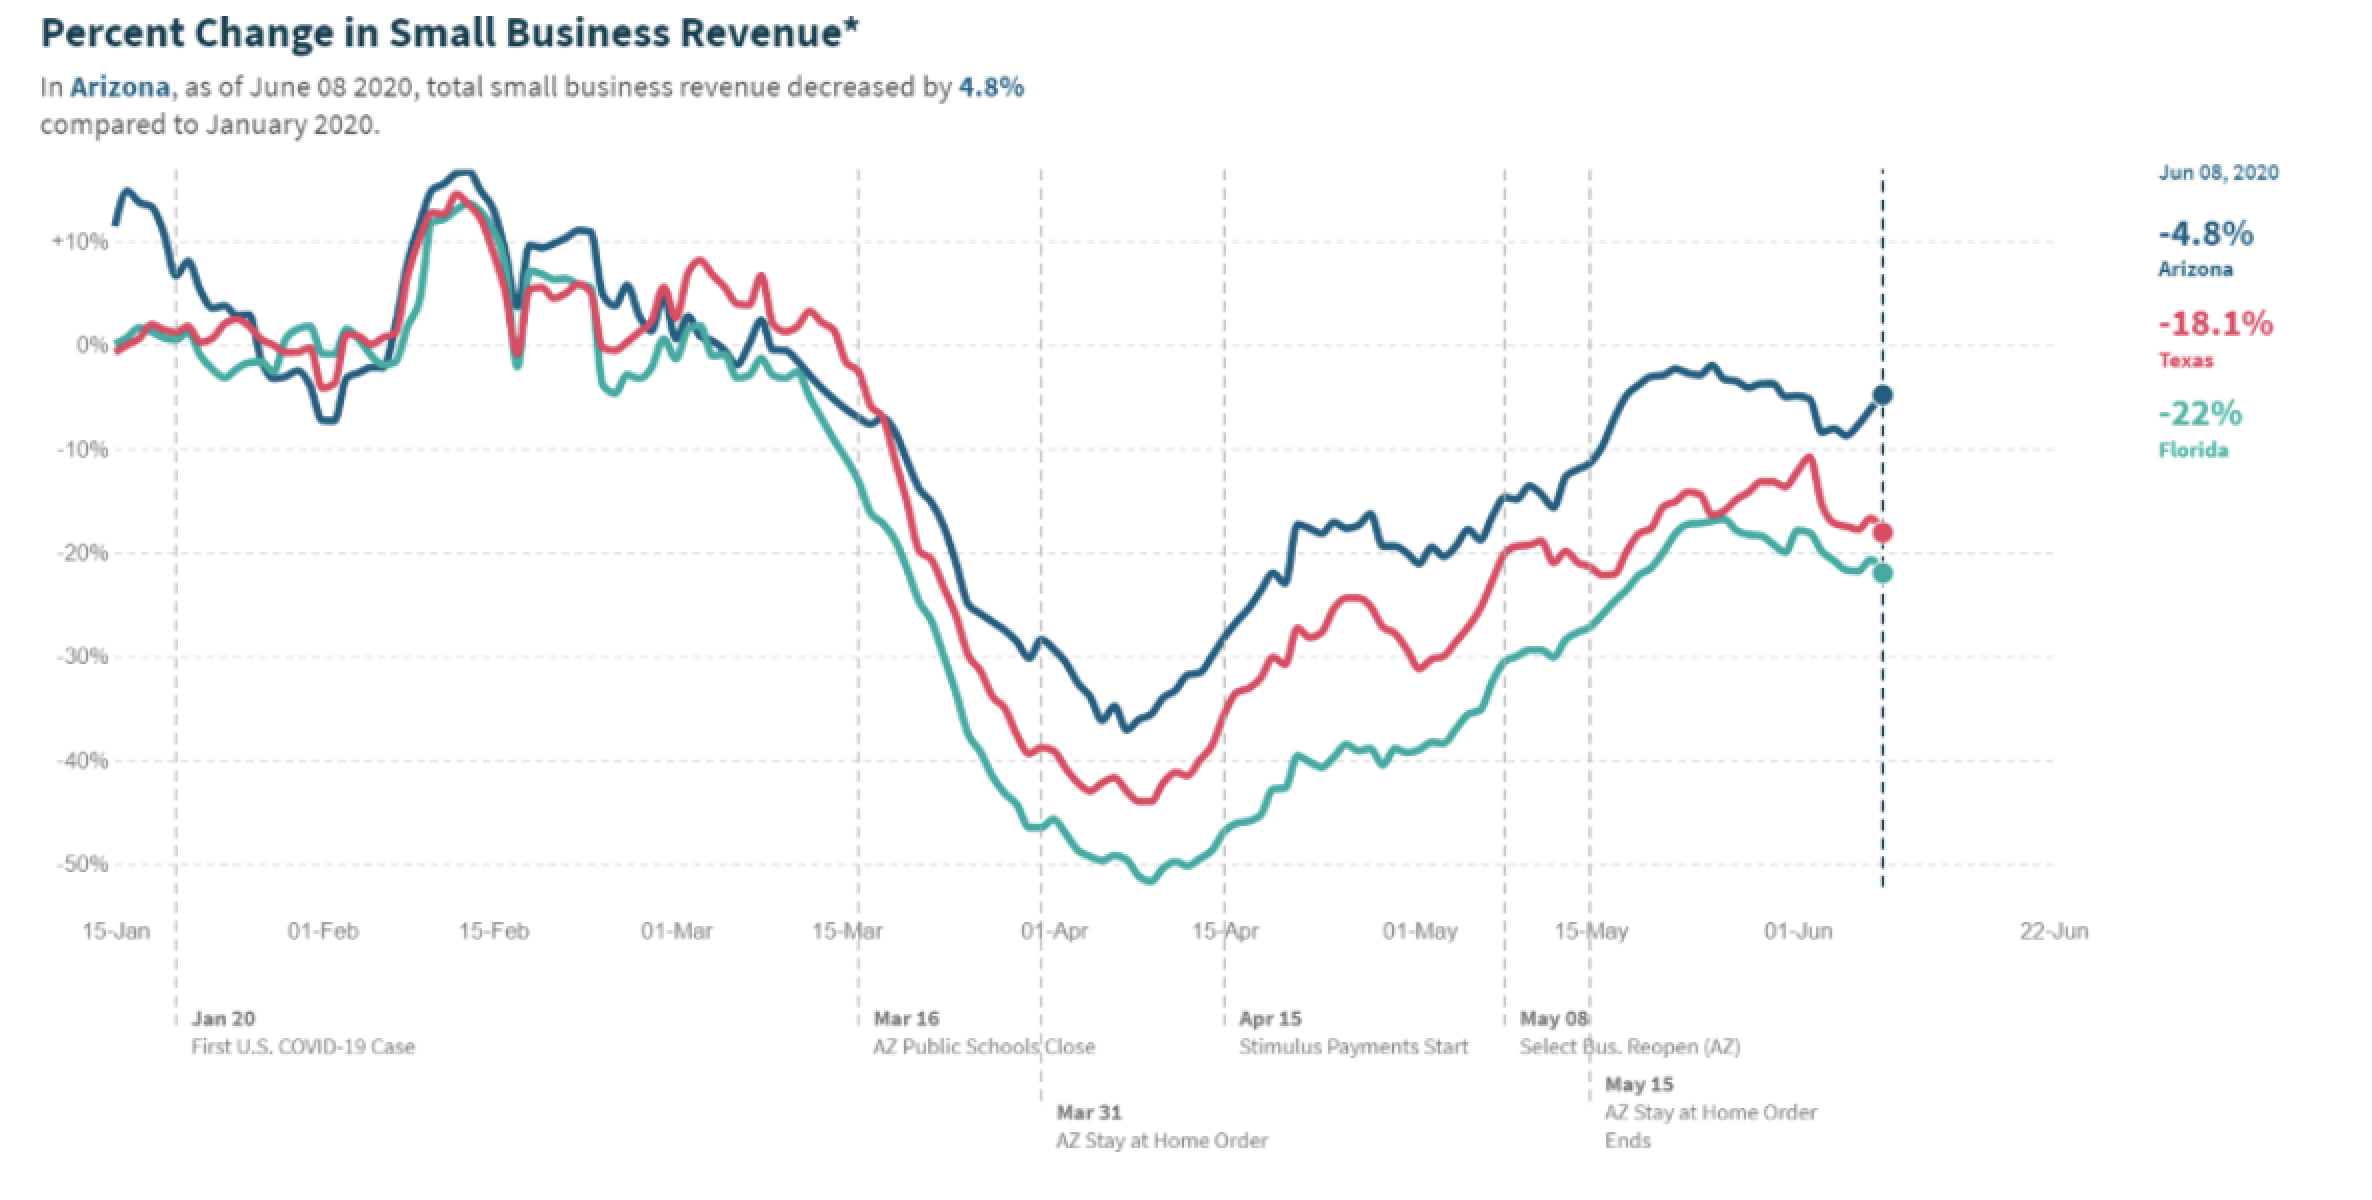
This decrease in mobility is leading to a decline in small business revenue in these states which had been rapidly improving since April but have since rolled over again in the last month.
The recent deterioration in small business revenue is directly tied to the number of small businesses open, and as small businesses are closing again their revenues are falling in concert.

There has been no V-shaped recovery in department store sales and with the COVID-19 outbreak intensifying, we are likely to see more brick-and-mortar layoffs to come as year-over-year department store sales remain near the extreme contraction seen in April.

In light of the worsening development in COVID-19 infections and deterioration in the economic improvement, we’ve started to reduce risk in client accounts from a neutral position on stocks to nearly a minimum stock exposure level. We began selling some of our most economically sensitive stocks on June 19 and further raised cash in client accounts earlier this week.
In addition to a darkening outlook regarding the impact of COVID-19, we have also noticed the lopsided nature of the market which caused many observers to comment that the stock market began to look devoid of economic reality. As mentioned in our prior articles, this is a result of record monetary stimulus that has pushed stocks higher. However, it’s also due to the skewed weighting of the technology sector and its outsized influence on the major stock indices.
The technology sector’s weight in the S&P 500 has grown considerably in the last decade due to the strong performance of technology giants like Apple and Microsoft. The technology sector has grown from roughly 16% of the S&P 500 back in 2007 to nearly 28% currently at the expense of the energy and financial sectors, which have not fully recovered from the Great Financial Crisis of 2007-2009.

The dominance of the technology sector and the FAANG +M (Facebook, Apple, Amazon, Google “Alphabet”, Microsoft) within the S&P 500 can be seen below where the circles represent the sector and member's weight within the S&P 500. Click here to go to a webpage where you can filter the sectors within the index from the image below.

The dominance of a handful of stocks is even more evident in the NASDAQ Composite which has thousands of members, but its returns are determined and dominated by only five companies. Click here to go to a webpage where you can filter the sectors within the index from the image below.

The year began with the technology sector dominating the S&P 500’s performance as it made up the bulk of the market’s return through February before it too began to decline. Now, the only two sectors that are positive for the year are technology and consumer discretionary where Amazon makes up nearly 25% of the sector alone. If it were not for the technology and consumer discretionary sectors’ influence, the stock market would be down much more than it currently is. Each of the 11 S&P 500 sectors’ contributions to the S&P 500’s returns this year is shown below with the S&P 500’s return shown by the blue line (note: S&P 500 data approximated using the SPDR S&P 500 ETF, SPY).

I’ve spent a lot of time discussing the influence of the technology sector as well as some other mega cap companies’ (Amazon, Facebook, Alphabet) influence on the market to show how trying to be a stock-picker is very difficult. As of June 25, the NASDAQ Composite was up 10.71% for the year while the median stock within the index is down over 16%. This means that the median stock within the NASDAQ is underperforming the index by nearly 27% as Apple, Microsoft, Alphabet, Amazon, and Facebook dominate the NASDAQ. While the underperformance in the median member vs the index for the S&P 500 large cap, S&P 400 midcap, and S&P 600 small cap indices is not quite as large, the average member is clearly not doing as well as the technology-heavy index as shown in the table below.

Conclusion:
I want to drive home two major points from the analysis above. The economy and average stock are not that far off in terms of their recoveries and the odds are stacked against stock picking in the current environment. When you look at what the average stock is doing, you can see that its performance more resembles the economy, which is nowhere close to recovering from its economic output back in February. Most stocks are nowhere close to recouping their losses from earlier this year. Further, the difficulty in stock picking is one of the prime reasons we are using broad-based ETFs so that our client’s equity allocation more closely resembles the performance of the index and not the median stock.
With such a dramatic rise in stocks off the March bottom and with deteriorating trends in the pandemic and economy, we felt it prudent to take some chips off the equity table after putting a lot of cash to work near the March bottom. Near-term we feel the risks are skewed to the downside, but we also believe the worsening COVID-19 pandemic and economic outlook will likely be met with more monetary and fiscal stimulus which should help to cushion the downside potential in risk assets. Should the facts change, and our cautious outlook prove too conservative, we will “change our minds” and act accordingly.
To find out more about Financial Sense® Wealth Management or for a complimentary risk assessment of your portfolio, click here to contact us.
Advisory services offered through Financial Sense® Advisors, Inc., a registered investment adviser. Securities offered through Financial Sense® Securities, Inc., Member FINRA/SIPC. DBA Financial Sense® Wealth Management.
Copyright © 2020 Chris Puplava


