


Overview
The delayed effect of monetary easing in 2008 and early 2009 and subsequent surge in money supplies globally has led to pronounced commodity inflation with acceleration over the last six months. In response to these rising inflationary pressures, central banks around the world began tightening by raising short-term interest rates and/or raising bank reserve requirements. This has had the desired effect of slowing economic growth rates which has contributed to a global economic slowdown. Given the massive financial and trade imbalances that were never resolved from the last crisis and recession, any economic weakness is more likely to develop into a recession than in a normal business cycle. Several countries are already showing inverted yield curves that often lead to a recession just as they did in the last business cycle. In the U.S., economic growth has throttled back considerably and it wouldn’t take much more of a deceleration in growth to start setting off recessionary alarm bells. Global stock markets and key commodities have already discounted much of this growth slowdown and have broken major support lines that have been in place since the economic expansion and bull markets that began in late 2008 to early 2009. Unless global economies begin to stabilize there is a real risk of yet another recession occurring on a global scale and also here in the U.S. Periods after major financial bubbles are prone to weak recoveries and relapses into new recessions as the imbalances that led up to the bubble are worked through. While no recessionary alarms for the U.S. and global economy have been rung yet, risks currently remain to the downside and global stock markets and commodities should be monitored closely ahead. Without a stabilization in global equities and commodities, the markets would appear to be sending a recessionary warning that should be heeded, and capital preservation and risk management should take center stage for investors.
It’s Global Monetary Policy, Not Japan, Causing Slowdown
The Economic Cycle Research Institute (ECRI) is well known for being the leaders in studying the business cycle both here in the U.S. and globally. The ECRI called for a growth slowdown in 2010 well before the summer swoon and also correctly said a recession would be avoided. In January of this year they released a report to their subscribers saying they expect a significant global slowdown to hit this summer, and made the call prior to the Japanese earthquake. In a recent interview with The Wall Street Journal, ECRI director Lakshman Achuthan shared his views with a paraphrase from the interview provided below (Click image for video link):

This is a key point because our indicators suggested a global slowdown to hit this summer before the Japan earthquake and before the Middle East unrest. Because of these temporary economic setbacks from Japan and the Middle East we fully expect to see a quick ‘dead cat’ bounce in global activity. This will be latched on by the Fed and others to prove we were just in a ‘soft patch’ or ‘speed bump.’ However, like I said, our indicators turned down well before those events which suggests to us any sharp economic bounce will be short lived and the slow economic malaise we are calling for will be persistent, pervasive, and pronounced and any temporary reprieve will be just that, ‘temporary.”
As Mr. Achuthan said, you can’t blame Japan for the global slowdown, but it’s the lagged effects of monetary easing that has led to a spike in commodity price inflation and then the reactionary monetary tightening to that inflation that is leading to a global slowdown. Don’t be fooled by Fed Chairman Bernanke or other optimists that would like to blame Japan for the slowdown, that argument just doesn’t hold water. For example, Francois Trahan from Wolfe Trahan & Co. looked at references to inflation versus Japan’s earthquake in the various US manufacturing surveys and, as you can see below, that very few references were to the earthquake as references to inflation was the dominating theme.

Source: Wolfe Trahan & Co., “Grabbing the Bull by the Horns” (06/20/2011)
The historical relationship between monetary policy and the business cycle is what is mostly at play here. One of the reoccurring events that happen prior to the onset of a recession is an inversion of the yield curve in which shorter-term interest rates are higher than longer-term interest rates as monetary policy by a central bank lifts short-terms to cool an overheating economy. Conversely, a steep yield curve, which encourages banks to lend, often precedes an economic expansion. To see this in action, below is the yield curve spread between 10 year and 2 year government bond yields. You can see that from 2003-2006 global central banks were raising short-term interest rates which compressed the spread between 10 and 2 year government bond yields. Starting in 2006 various countries began to experience an inverted yield curve (see red shaded region) which led to a decline in economic growth rates that eventually led to a global recession in 2008. In response to the slowdown central banks cut interest rates significantly in that same year which then forced the yield curve to steepen and turn positive once more (green shaded region). This monetary easing set the stage for the economic recovery in 2009. Beginning in 2009 we began to see commodity inflation spike due to lower interest rates and increased money supplies globally. In response to rising inflation world central banks began to raise short-term interest rates in late 2009 and into 2010, which has led to a compression in yield curves globally (yellow shaded region). It is this monetary tightening and the commodity inflation from prior easing that is weighing on global growth. If monetary tightening and the slowdown in growth persists, there is an increased chance of a recession in individual countries, particularly those with inverted yield curves. Due to its monetary tightening Brazil already has an inverted yield curve and another BRIC country, India, is on the verge of seeing its yield another inversion of the curve. The more yield curve inversions we see globally the more likely we are to see a global recession.

Source: Bloomberg
Monetary tightening first began to occur globally in mid 2009 and into early 2010, with the effects seen in peaks in industrial production (IP) later in mid 2010. Since mid 2010 IP growth rates in the G7 countries have continued to decline. Prior to Japan’s earthquake their IP was slowing sharply before other G7 countries and their earthquake only exacerbated their slowdown and pushed their IP to a negative 12.6% growth rate. The UK and Italy’s IP growth rates are now negative and other G7 nations rates are in the low single-digits and at risk of turning negative.

Source: Bloomberg
Turning to the U.S., we can see that our own economic growth has slowed down considerably and it wouldn’t take much further weakness to begin raising some recessionary red flags. For example, the Philadelphia Fed Coincident Index’s 1-Month Diffusion Index is on the verge of falling below the key 50 level. Since the inception of the data in the early 1980s, we have fallen into a recession every time it has done so with no exceptions, and May’s 54 reading leaves very little room for further downside deterioration. Looking at the past three decades of history, the 1-Month Diffusion Index falls below 50 on average 4.75 months prior to the onset of a recession, and a sub 50 reading for June may suggest a chance of the U.S. falling into another recession by the coming fall.

Source: Bloomberg
While our own recession probability model suggests only an 8% chance of a recession occurring within the next six months, its May reading showed the first uptick since the economic expansion began in 2009 and we will be monitoring it closely for a reading north of 20%, which has led to only one false signal over the last thirty years (1987).

Source: Bloomberg
Global Markets Displaying Economic Weakness, Highlights Risks are to the Downside
A quick survey of global stock markets and commodities shows significant breakdowns that highlight rising risks of recessions and bear markets. Major trend lines and support levels have been broken as markets discount the economic weakness that lies ahead. The further they deteriorate the greater the probability that the current global slowdown develops into another recession.
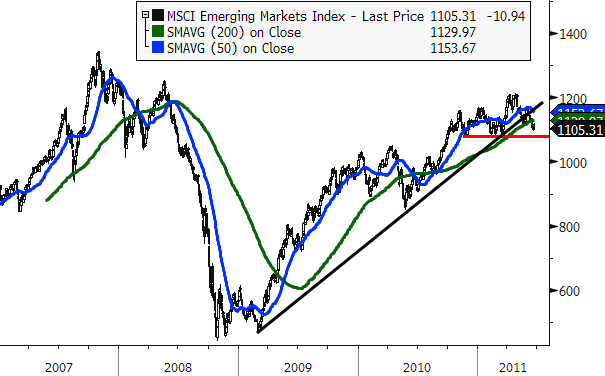
All does not appear well for the world’s economic growth engine, the emerging markets, as their stock markets are breaking down. The MSCI Emerging Markets Index has broken through its 2009-2011 trend line support (black line) as well as its 200 day moving average (200d MA). A break below the late 2010 and early 2011 lows near 1080 would be quite bearish and likely indicate that emerging markets have peaked and are in a bear market.
Source: Bloomberg
Looking at THE global growth engine, China, shows a major breakdown recently that needs to be reversed in a hurry for the global slowdown not to develop into something more bearish. China’s Shanghai Composite broke its 2008-2011 trend line and has been in a bearish trend ever since it peaked in 2009. Given China is the global marginal consumer of commodities, its not surprising to see weakness in commodities currently.

Source: Bloomberg
The South Korean KOSPI Index, also-known-as “Dr. Kospi” as it is a great leading economic indicator, has yet to break its 2009-2011 trend line but if it does it will also break its 200d MA and add to the bearish list of breakdowns.

Source: Bloomberg
Brazil’s Bovespa Stock Index was turned back at its 2008 top and subsequently broke its 2008-2010 trend line support and its 200d MA. Since then it has been in a declining channel and is down nearly 18% from its highs and on the verge of entering official bear market (20%+ decline) territory.

Source: Bloomberg
Emerging markets aren’t alone in the breakdowns as developed markets globally are following suit. The base metals-sensitive Australian All Ordinaries index has broken its accelerated 2009-2011 trend line and also its other 2009-2011 trend line that begins from the 2009 summer low. The Australian market is particularly weak as it failed to take out its 2010 high and made a double top in 2011 and is now rolling over and below its key 50d and 200d MAs.

Source: Bloomberg
Canada’s S&P/TSX Composite Index (energy price sensitive) has also broken its 2009-2011 trend line and its 200d MA and is now in a clear declining channel that has yet to be broken.

Source: Bloomberg
Turning to commodities, two key commodities (oil and copper) tied to global economic growth are literally on the edge as they too are testing their bull market trend lines that go back to the 2008-2009 lows. West Texas Intermediate (WTI) crude oil is not only testing its 2008-2011 trend line but also its 200d MA. A break below will likely see oil dip into the low s and possibly even lower.

Source: Bloomberg
Copper hsa also been in a bearish trend this year and is testing its 2008-2011 trend line and 200d MA. A break below /lb for copper could see a decline down towards /lb, adding yet another piece to the emerging bearish picture globally.

Source: Bloomberg
Risks are Rising as Capital Preservation Takes Center Stage
While no recessionary alarms for the U.S. and global economy have been rung yet, risks currently remain to the downside and global stock markets and commodities should be monitored closely ahead. Without a stabilization in global equities and commodities, the markets would appear to be sending a recessionary warning that should be heeded, and capital preservation and risk management should take center stage for investors.


